On July 17-19, 2026, Megaladata took part in e-Logi Fest 2026, Armenia's leading international event dedicated to logistics, e-commerce, and supply chain innovation.
Use Case: dimedis

AI-based camera and sensor data collection for digital marketing. Real-time processing and generating recommendations based on key metrics.
dimedis GmbH is an IT company from Germany, founded in 1996 in Cologne. The name "dimedis" stands for "digital media distribution": The company specializes in developing web-oriented software solutions for digital signage and customer management at exhibitions and events.
As more and more companies strive to increase advertising efficiency and ROI, dimedis launched the development of this project to respond to the market needs.
Project goals and objectives
The project was conceived as a technological solution that would enhance the efficiency of targeted advertising at retail spaces. The main practical goal is to show advertising highly tailored to the demographic profiles of customers in different trade floor areas.
Reaching this goal included the following tasks:
- Deployment of data collection infrastructure: Installing sensors in various retail zones to gather the most comprehensive information about the customers inside the store.
- Prompt collection and analysis of customer data: Receiving accurate real-time information on the visitors' key metrics.
- Visualizing data for business users: Visual representation of demographic data for analysis and decision-making.
- Personalization of advertising content: Adjusting visual and text content based on the audience demographic parameters (gender, age, height, etc.).
Project challenges
At the start of the project, the developed system demonstrated high performance and stability. However, rapid network scaling and an increasing number of sensors in retail points led to a significant increase in data volume. This spotlighted the need for a powerful tool to process and analyze this data.
Also, other issues have arisen, such as:
- Disparate unstructured data requires more sophisticated processing.
- Lack of a single system for demographic data aggregation, validation, and analysis.
- "Manual" analysis by IT specialists slows the process down.
- Delays in decision making due to the lack of timely access to the latest information.
Megaladata was chosen as the main backend tool for the project due to the platform's unparalleled performance. It became a computational core, effectively processing large real-time data streams. Megaladata was also a great fit as it could solve a wide range of the project's crucial tasks:
- Processing large amounts of data from multiple sensors. Sensors and cameras of various types were placed at many retail floors to collect the customers' demographic data—gender, age, height, etc. Megaladata provided fast aggregation and analysis of these data streams distributed within many retail floor zones.
- Data structuring and cleaning. Collected data always comes with some issues—duplicated records, missing or invalid values, outliers, etc. Megaladata detects and handles such issues automatically, creating a comprehensive and precise picture of the store's demographics.
- Data validation and identification mechanisms. The platform verifies input data against certain rules and maps it to already existing records. This is essential for reliable analytical reports and accurate personalization of advertising messages.
- Generation of real-time data slices based on key metrics. One of Megaladata's most significant advantages was the ability to generate analytical reports and statistics immediately, without the involvement of programmers or the need to write manual requests. This allowed marketers and business teams to react to changes swiftly, adjusting advertising campaigns on the go.
Solution
The company deployed an extended network of sensors within multiple retail floors to collect customer demographics. There are sensors of three types: Protech, Xovis (two versions), and Dahua (also two modifications). These sensors were placed at various retail floor zones, such as: the entrance, POSs, queue areas, and certain product zones—depending on the needed information and the customer flow specifics. Each sensor collects customer demographics—gender, age, height, etc.
Every five minutes, all data collected by the sensors is sent to an Amazon S3 cloud storage. The input data is transferred as CSV files which are then processed into the JSON format, which ensures processing convenience and compatibility with other analytical tools. Preprocessing—such as data cleaning, normalization, and structuring—is performed using AWS Lambda functions operating in serverless mode. This ensures the scalability of processing according to the input data amounts, allowing for a more efficient use of resources and fewer additional infrastructure costs.
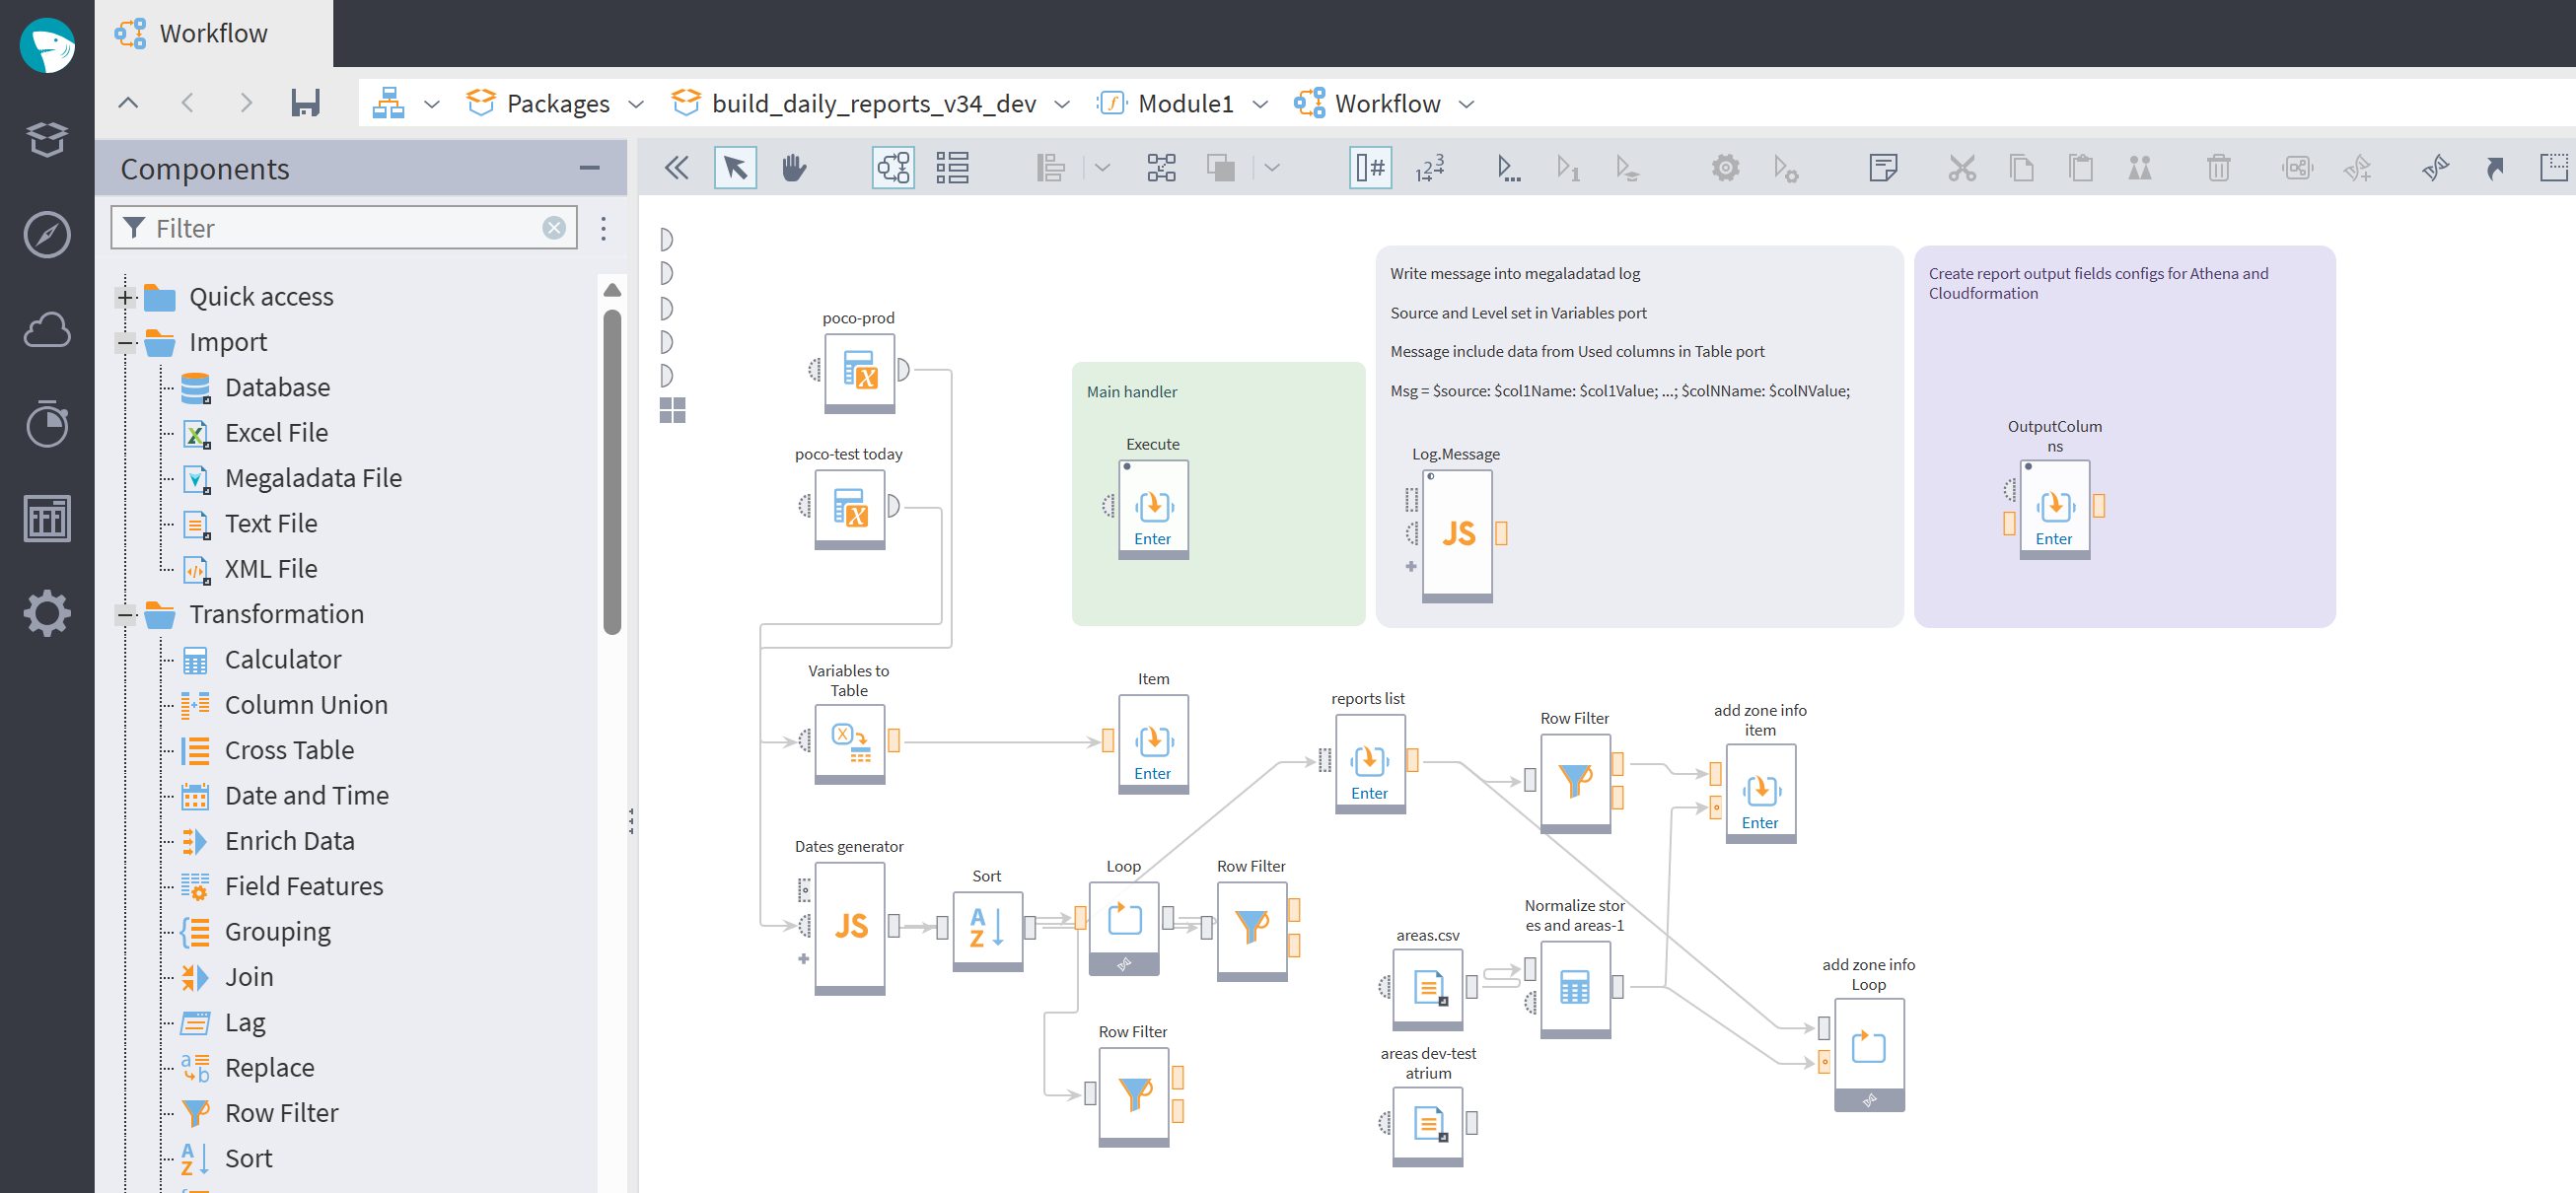
Megaladata serves as the core element of the architecture, implementing complex analytics and business logic without programming. The platform's visual interface allows users to create processing and calculation workflows through business algorithms instead of coding.
Megaladata helped solve the most critical tasks of the project:
- Automated data processing, including transformation, aggregation, and preparing data for a no-code analysis.
- Accounting for the specifics of different types of sensors. Each type has its own accuracy parameters, data format, and transmission lag time.
- Data identification, validation, and cleaning. The platform detects and eliminates duplicates, missing values, and outliers, ensuring the high quality of input data.
- Calculating aggregated metrics (e.g., average age in a retail zone, gender distribution, customer flow intensity, etc.) with the interval of 15 minutes, considering the historical data of the previous 24 hours. This allows for both real-time and retrospective monitoring.
- Considering data weight and accuracy, depending on the sensor type. This is critical when aggregating information from different devices operating in the same zone.
Project workflow
All the system's logic is implemented through the intuitive visual interface. It allows business users, such as analysts, marketers, or administrators, to manage the process independently, without developers' assistance. Megaladata outputs a unified table with all the necessary data slices and aggregated metrics, ready for visualization in interactive BI systems or dashboards.
Results
After processing and aggregating data, Megaladata automatically sends it back to the Amazon S3 storage. From there, the data is transferred to a specialized BI system that integrates the data and visualizes analytical metrics. These are then included in interactive dashboards available to marketers and analysts in real time.
The dashboards provide specialists with precise and updated information on the retail floor visitors' demographics. The experts can track the distribution of customers based on different metrics, such as age, gender, etc. They can monitor such distribution during different opening hours, in different retail floor zones, or within certain historical periods. This provides the opportunity to detect stable patterns and seasonal fluctuations in the audience, which is critical for the long-term planning of marketing activities.
Based on the collected and analyzed data, the user can generate a targeted advertising strategy that would account for the actual audience specifics and behavior at each particular place. Thus, the advertising content can be adjusted to each customer group profile, made more relevant and, consequently, more engaging and efficient.
The workflow in the system is then a complete cycle—from data collection to decision-making—allowing businesses to act based on accurate, timely, and human-friendly (visualized) information.
Using analytical metrics increased advertising relevance and, thereby, conversion. Pilot launches have demonstrated a more rational use of advertising budget and an increase in ROI.
Employing Megaladata and developing a precise data processing architecture helped solve the main issues that had appeared at the initial stage of the project:
- Disparate data from different sensors is unified and aggregated in a single system.
- The data is cleaned and structured by the system; duplicates and anomalies are eliminated.
- The system provides real-time analytics automatically, with no involvement of IT specialists.
- Delays in accessing up-to-date information and decision-making decreased significantly.
Thus, the system not only combats the technical and organizational challenges of scaling, but also provides a stable, scalable, and flexible basis for the efficient management of targeted advertising in retail zones.
Performance and advantages
The system currently processes significant data amounts continuously. Each cycle handles 2 million records in less than 1.5 minutes, which illustrates the advanced performance of the developed solution and its ability to effectively process data streams from tens to hundreds of sensors distributed across a retail chain.
In addition, the system is flexible and scalable. It can be easily adjusted to different scenarios, workflow changes, or new data sources, without any need to change the source code. This makes the solution most convenient for development and management under rapidly changing business conditions.
The solution provides detailed breakdowns by customer gender, age, height, and other metrics, considering the overall number of visitors and their distribution across certain time intervals and retail floor zones.
Additionally, the solution allows users to predict the characteristics of future customer groups based on historical data and tailor the digital advertising content to fit the predicted demographic profile of the audience.
Visual interface and automated business logic reduced the need to involve developers, shortening the marketing analytics "question-answer" cycle from days to minutes.
See also

Megaladata at e-Logi Fest 2026

How Low-Code is evolving ETL
In 2026, you cannot scroll LinkedIn for five minutes without finding a post declaring "ETL is dead, ELT and AI have replaced it." It sounds compelling. It is also wrong.

Megaladata at Plug and Play Armenia Batch 3 Expo
On July 9, 2026, Megaladata took part in the Plug and Play Armenia Batch 3 Expo, the graduation event closing out the three-month International Pre-Acceleration Program in Armenia.
About Megaladata
Megaladata is a low code platform for advanced analytics
A solution for a wide range of business problems that require processing large volumes of data, implementing complex logic, and applying machine learning methods.
GET STARTED!
It's free