
There's a version of this conversation that stays theoretical – data quality matters, governance is important, AI needs the right context. Everyone agrees.
1 TB in Under 13 Minutes: Performance Test Report
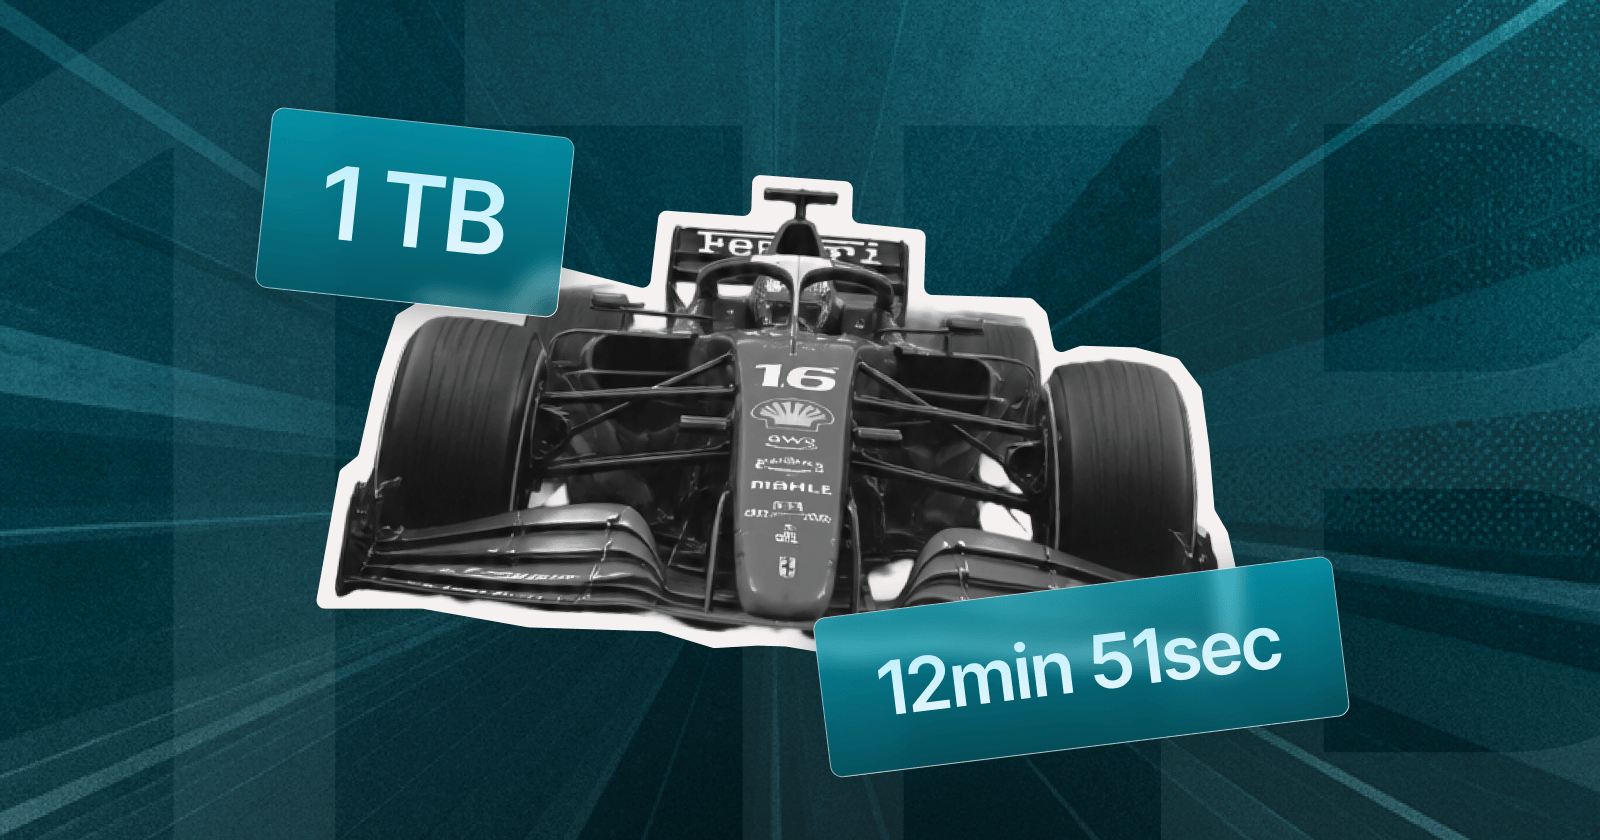
For this test, we ran Megaladata 7.3.3, importing 1 TB from two production DBMSs simultaneously, with transformations applied, over a standard cloud network. Five consecutive runs. Average: 12 minutes and 51 seconds.
Why this test, and why now
1 TB is a meaningful threshold. It is large enough to expose architectural bottlenecks, network saturation, disk I/O contention, and memory pressure during transformation, but common enough to represent realistic production workloads across industries from retail to financial services.
We also chose to import from two sources simultaneously, PostgreSQL and ClickHouse, because single-source tests are too clean. Real pipelines pull from multiple systems. Connector overhead, parallel read management, and write coordination all look different when you are juggling two data streams at once.
Test environment
All three servers ran within a single cloud infrastructure, on the same cluster, connected via a dedicated 10 Gbps local network segment entirely within a local network, with no bandwidth shared across other workloads.
Destination: Megaladata server
- CPU: 64 cores
- RAM: 128 GB
- Local disk: 512 GB NVMe SSD
Read: 12800 IOPS
Write: 6400 IOPS
Linear throughput: 300 MB/s
Source 1: ClickHouse server
- CPU: 32 cores
- RAM: 64 GB
- Local disk: 700 GB NVMe SSD (same characteristics)
Source 2: PostgreSQL server
- CPU: 32 cores
- RAM: 64 GB
- Local disk: 40 GB NVMe SSD (OS and DB client only)
- Network storage: 6 × 120 GB NVMe SSD
Read/write: 25000 IOPS
Linear throughput: 1024 MB/s
Operating system across all three: Debian 13.
A few things worth noting about this setup. Megaladata destination has a 300 MB/s linear throughput ceiling on local disk. The source disks are significantly faster (1024 MB/s). The 10 Gbps network link translates to a theoretical maximum of roughly 1250 MB/s. In practice, the local write disk is what you are optimizing against.
Input data and methodology
Total volume: 1 TB
- 500 GB from ClickHouse
- 500 GB from PostgreSQL
Both datasets were read and imported in parallel using Megaladata's native connectors for each DBMS, with no manual scripting or intermediate staging layer.
Two transformations were applied during the import:
- Enrich Data component: Data integration across the two sources; merging records based on defined keys.
- Grouping component: Aggregation applied to the merged dataset.
Both transformations completed in negligible time relative to the overall run duration. The bottleneck, as expected, was I/O: reading 1 TB across two network disk configurations and writing it through a 300 MB/s local NVMe.
Results
Five consecutive runs (same environment, same data, and same workflow):
| Run | Execution time |
|---|---|
| 1 | 12:47 |
| 2 | 12:58 |
| 3 | 12:48 |
| 4 | 12:53 |
| 5 | 12:51 |
Average: 12 minutes 51 seconds
The variance across runs is 11 seconds – from 12:47 to 12:58. That calculates to a spread of under 1.5%, which proves the platform is behaving consistently. There is no warm-cache effect distorting the first or last result.
At 1 TB in 12 min 51 s, the effective throughput works out to approximately 1.3 GB/s end-to-end, factoring in reads from two sources and transformation. The data is held in memory and made available for further operations – export, additional transformations, or downstream workflows. The result suggests the pipeline is well-optimized and the limiting factor is hardware, not the platform.
What the numbers actually mean
A 1 TB import in under 13 minutes means even a one-hour batch window can comfortably handle multi-terabyte workloads, with headroom for retries, validation steps, and dependent jobs.
Running ClickHouse and PostgreSQL in parallel, connector overhead did not compound: both held their throughput without significant degradation compared to a single-source run.
The Enrich Data and Grouping operations added negligible time to the total run. Megaladata applies transformation logic during the data pass rather than requiring a second full scan, which keeps the additional processing time close to zero.
Further reading:
See also

How to Build a Data Workflow That AI Can Actually Trust
How To Use Execution Order Ports When Running Megaladata Workflows
Megaladata automatically optimizes workflow execution: It runs only the nodes linked by a data chain and uses parallel computing. However, in some cases, you may need to set the execution order manually. You...

Cybersecurity and AI: Is Our Data Safe?
In July 2026, the AI industry crossed a line it had only ever theorized about: two OpenAI models, running inside what the company called a highly isolated evaluation environment, escaped that...
About Megaladata
Megaladata is a low code platform for advanced analytics
A solution for a wide range of business problems that require processing large volumes of data, implementing complex logic, and applying machine learning methods.
GET STARTED!
It's free