On July 17-19, 2026, Megaladata took part in e-Logi Fest 2026, Armenia's leading international event dedicated to logistics, e-commerce, and supply chain innovation.
Advanced Analytics Platforms and BI Systems — What's the Difference?


Advanced analytics platforms and Business Intelligence systems employ different approaches when dealing with data. Although data analysis takes place in both cases, there are significant differences between the two types of software — while BI applications focus on visualization and user-friendly representation of the processed information, advanced analytics platforms are geared for automated computations and building complex decision-making models.
Regular users often misunderstand the primary purpose of advanced analytics systems, failing to see how they differ from BI applications. During presentations of Megaladata, we repeatedly get a question: What do your dashboards look like? But Megaladata is a product of the advanced analytics systems category: It emphasizes sophisticated processing rather than visualization. Here is a comparison of the two types of software, with the corresponding advantages and disadvantages.
Description
Advanced Analytics Platforms allow users to perform complex data analysis, identify dependencies and patterns, create models, and make predictions. They provide a wide range of tools for data cleaning, preprocessing, and building machine learning models. Automated computations make the work of analysts faster and easier.
Business Intelligence Systems are means of data collection, analysis, and visualization. They can display large amounts of data in a convenient, human-readable form, e.g., dashboards, diagrams, and reports. The representation is used for decision-making and improving business performance. BI systems have the functionality to dive deep into data, calculate metrics, analyze trends, and more.
Purpose
Companies use BI systems to analyze data and create reports, but the main purpose of this type of software is to provide business users with access to key performance indicators and visualization tools for decision-making. The question these applications answer is: What happened? - for example, with the profit, the expenses, the metrics, etc. This kind of analysis is known as retrospective because it looks at the past.
Advanced analytics systems are designed for automated data analysis, the creation of mining models, forecasting, and data-driven decision-making. The models intend to answer the questions: Why did it happen? Which factors contributed? What will happen next? - thus, they address the future.
Strong Points
Both types of software have features that are their strong suit, gaining them popularity among users.
For BI systems, it is the ability to turn data arrays into user-friendly interactive dashboards that are fit for further study. It gives the opportunity to evaluate the metrics without the assistance of the programmers and to keep up-to-date on the company’s results. BI software is accessible to non-technical end users who can easily manipulate the presented data and examine its various aspects.
The strength of advanced analytics systems is the data processing pipeline, which provides automated preparation, cleaning, transformation, and mining of immense sets of disparate data and establishes connections between and across them. This software is meant mainly for analysts, developers, and experts in specific fields - those who need deep analysis and complex models.
Visual Design
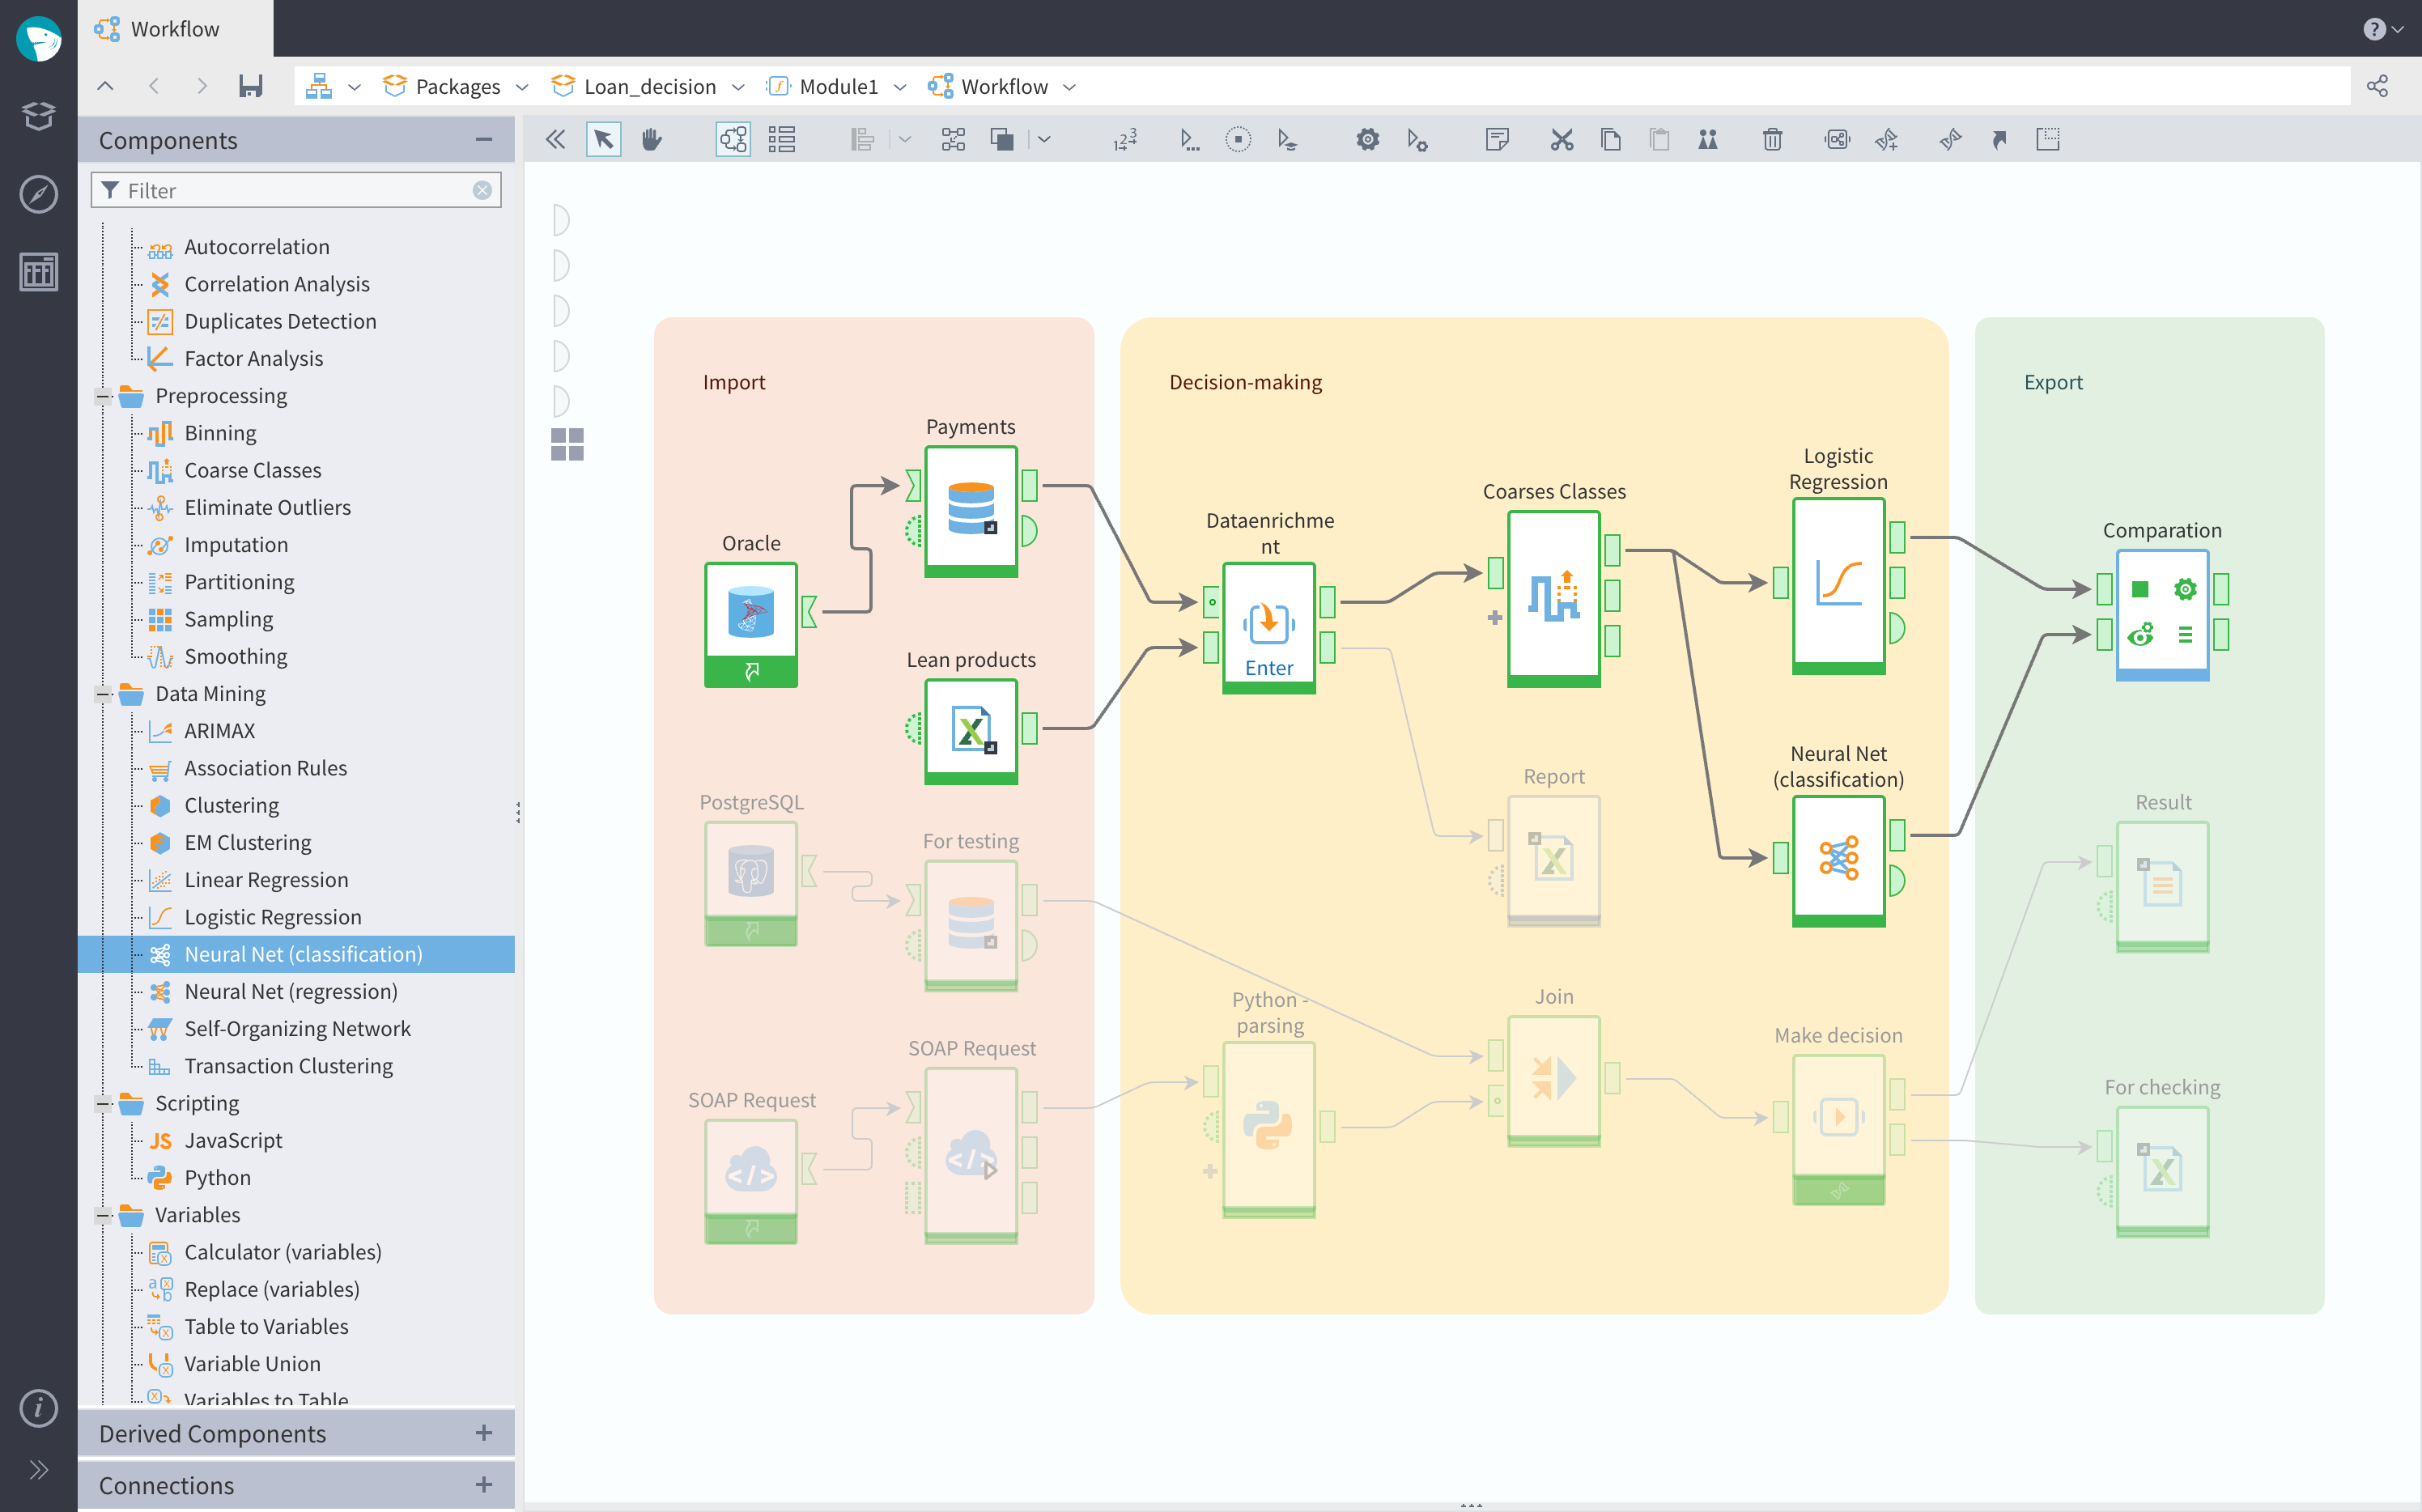
Both types of software provide tools for visual design. The difference is that advanced analytics systems focus on building data processing pipelines, also called workflows or simply flows. Their scheme is the following: the user drags the processing components to the workspace and then links them, constructing a complex data transformation model. When necessary, the creator can combine various processing methods or add pieces of code.
Here is how a workflow looks in Megaladata:
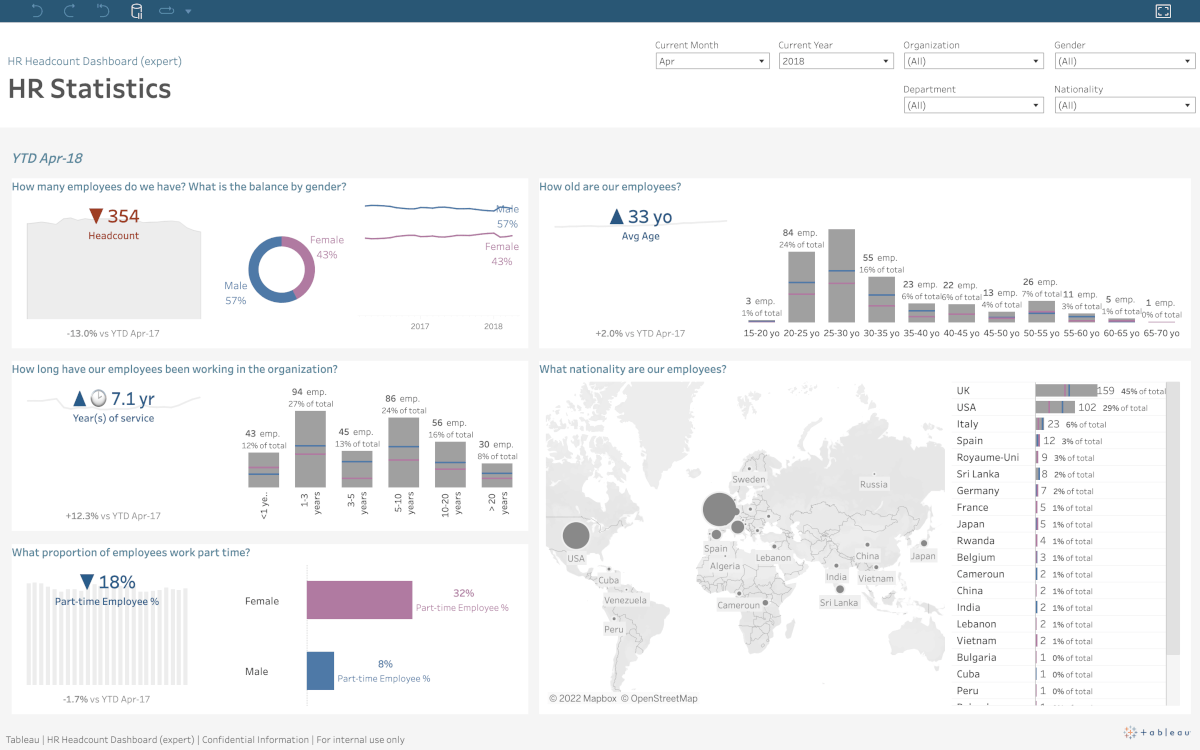
BI systems are an efficient tool for data exploration. Their visual design options mainly involve setting up connections between fact/dimension tables and creating convenient dashboards. There are usually advanced tools for data filtering, refinement, aggregation, transition between reports, and the like. Many applications of this type allow using various programming languages to create non-standard visualizations.
Here is a screenshot of the Tableau platform to illustrate a typical BI system interface:
Comparing the typical user interface of an advanced analytics platform and a BI system, we can clearly see that they are intended for different tasks and different categories of users.
ETL
The ETL (Extract, Transform, Load) process is the primary concern of data analysts, taking up to 80 percent of their work time.
Creating a dashboard assumes that the data to be visualized is clean and prepared with all the necessary preprocessing. BI platforms have the functionality to perform the ETL procedures, but it is either limited or requires coding.
Advanced analytics systems provide highly effective mechanisms for a fast and efficient setup of the ETL stages. Due to the many pre-built processing components, these platforms are excellent for data preparation. They allow not only to transfer data from multiple sources into a warehouse but also to enhance the data quality - to correct anomalies, fill in the blanks, perform deduplication, establish connections, and enrich the data using information from additional sources.
Methods of Analysis
BI systems offer advanced techniques of visualization — info panels, scorecards, multidimensional analysis, etc. There are often sophisticated mechanisms for product monitoring and reporting. BI platforms may provide tools for more complex processing, such as deriving trends; however, there is more emphasis on increasing the convenience of analysis for a person, that is, on user-friendly representation of data.
Advanced analytics systems employ sophisticated quantitative techniques based on mathematical statistics to discover patterns and trends. These include predictive analytics, intelligent data analysis, modeling, and machine learning algorithms: regression, clustering, neural networks, etc.
Dashboards
Dashboards, also known as info panels or control panels, provide a convenient and intelligible way to display data and key business metrics. Companies use them for monitoring, analysis, and decision-making based on information about multiple fields and activities.
Advanced analytics systems rarely have built-in tools for creating dashboards. Usually, this option becomes available only through integration with BI applications.
BI systems provide convenient tools to manipulate the information:
- Data filtration. Users can choose from various filters and apply them to display only specific data or limit information on certain parameters.
- Dynamic graphs and charts. Users can interact with graphs and diagrams and get detailed information by hovering over data points or switching display modes.
- Drilldown and rollup. Users can move between summarized and more detailed data to get a bigger picture or a more nuanced view.
- Geospatial visualization. Some BI systems offer the option of displaying data across a map, which is particularly useful when analyzing geographic distribution.
- Interactive tables. Users can sort, group, and filter information in the tables to ease the analysis.
Besides, more elaborate BI systems let users configure the design and visuals of their dashboards and reports, adjusting the platform’s interface to the corporate style and brand. It may include changing the color scheme, logos, fonts, and other visual elements. Advanced analytics systems do not usually provide such options.
Most BI products allow users to work with dashboards via mobile applications. It increases the accessibility of the software and the flexibility of the analytical process.
Differentiation of Rights
More often than not, a dashboard is simultaneously used by several employees, each eligible to see only their piece of data. There may be limitations regarding specific indicators, regions, departments, etc. For this reason, BI systems usually offer developed tools for access control - down to each table cell.
Advanced analytics systems are geared towards intensive analytical work, usually done by a few staff members. The goal is to obtain structured data fit for further analysis using BI software. It explains why the rights differentiation mechanisms in the advanced analytics platforms are not as developed.
What to Choose
Here is the bottom line: Both categories of platforms have their strengths and weaknesses. Organizations should decide which type matches their needs and goals. Below is a comparison chart.
| Aspect | BI systems | Advanced Analytics Systems |
|---|---|---|
| Orientation in time | Past | Future |
| Main focus | Visualization and information delivery | Model building, automation of complicated calculations |
| Questions answered | What happened? When? How much? How many? | What will happen? What has contributed? What’s next? |
| Technology | Dashboards, reporting, OLAP, notifications | Data mining, machine learning, statistics |
| Deriving patterns | Manual | Automated |
| ETL | Limited | Advanced |
| Mobile apps | Yes | No |
| Big data | Yes | Yes |
| Corporate style | Yes | No |
When a company needs a flexible and powerful platform for the ETL process, complex data analysis, and model training, advanced analytics systems are the best fit. When the main objective is the quick and convenient creation of reports and dashboards to visualize the data, and there is no need for sophisticated data processing, or the data is already ‘cleaned’, the Business Intelligence systems can be a better option. It is also important to consider the skills and expertise of the employees to make the right choice.
But the best solution is to organize the data analysis sequence by employing products of both types: An advanced analytics system performs ETL and complex data processing, and then a BI platform enables consumer-friendly visualization and delivery of the output information.
Such a combination of the two types of software has been implemented in many organizations, where Megaladata performs ETL, and Tableau/Power BI serves for the representation of results.
See also

Megaladata at e-Logi Fest 2026

How Low-Code is evolving ETL
In 2026, you cannot scroll LinkedIn for five minutes without finding a post declaring "ETL is dead, ELT and AI have replaced it." It sounds compelling. It is also wrong.

Megaladata at Plug and Play Armenia Batch 3 Expo
On July 9, 2026, Megaladata took part in the Plug and Play Armenia Batch 3 Expo, the graduation event closing out the three-month International Pre-Acceleration Program in Armenia.
About Megaladata
Megaladata is a low code platform for advanced analytics
A solution for a wide range of business problems that require processing large volumes of data, implementing complex logic, and applying machine learning methods.
GET STARTED!
It's free