Automating Repetitive Tasks: A Boost for Productivity


Importing Data
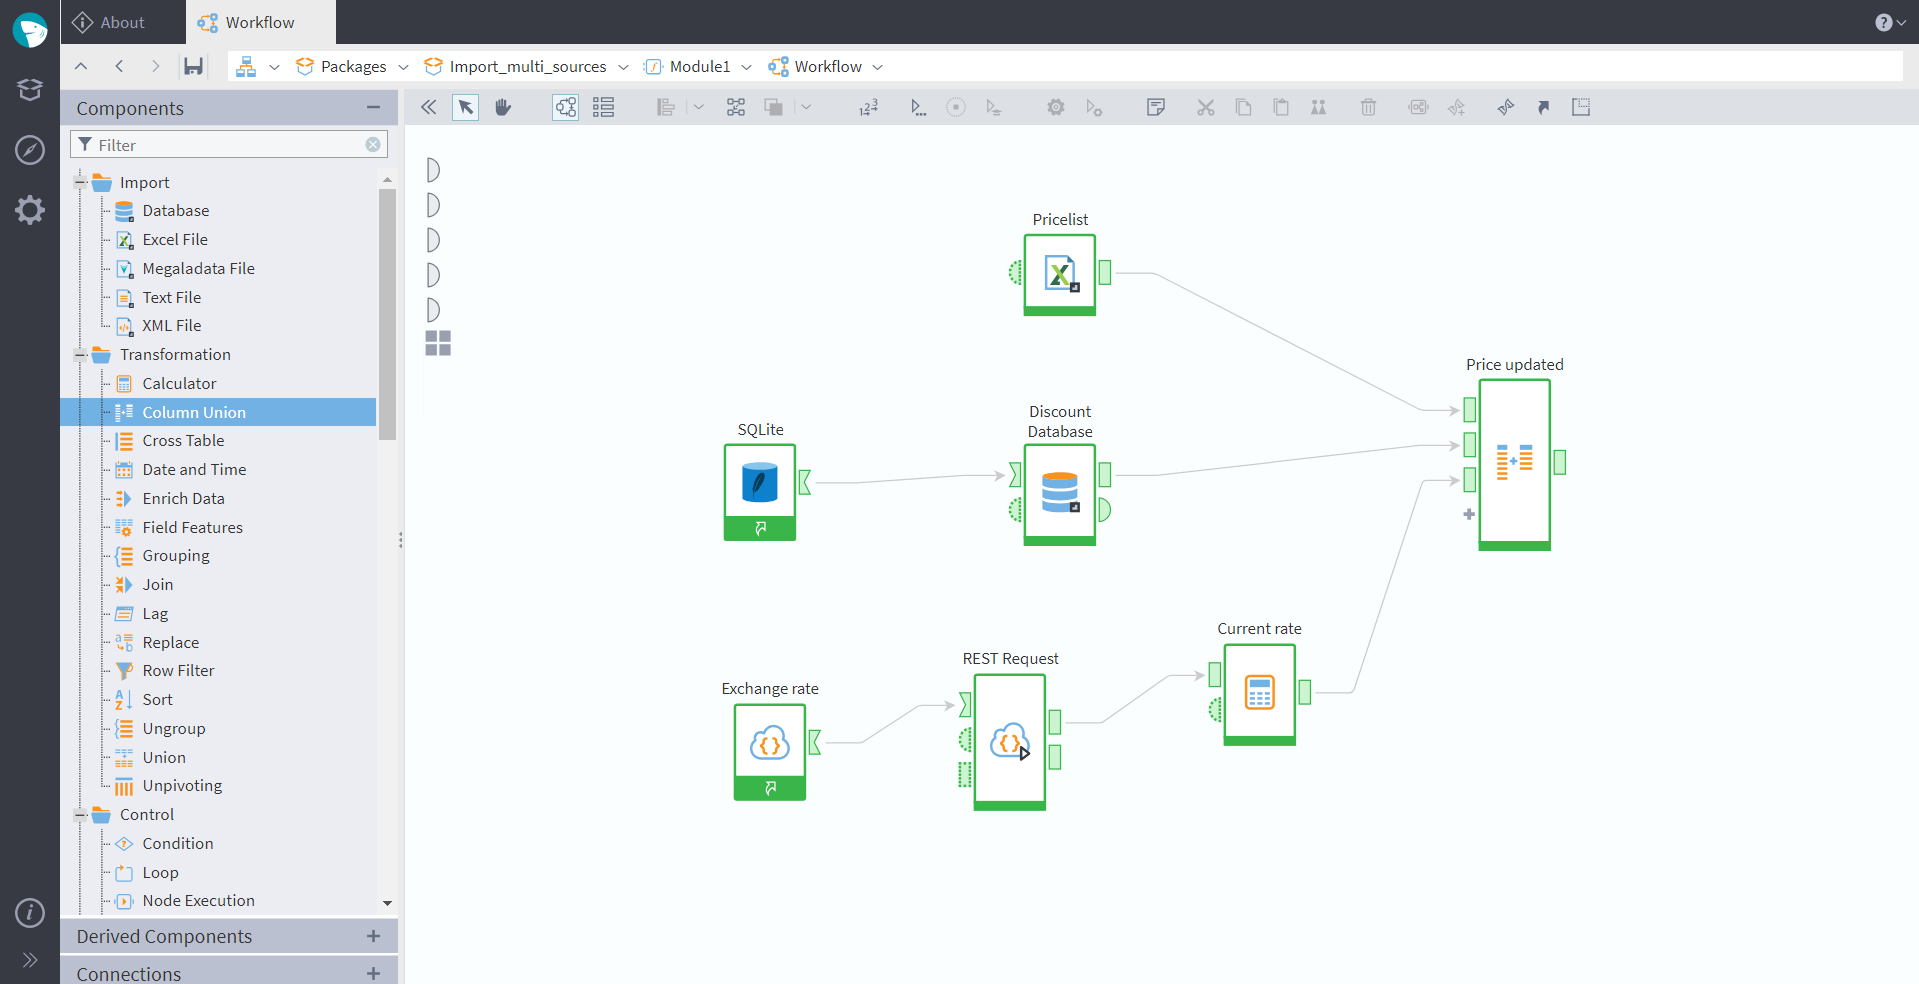
Basically every analytical model requires data to be imported from somewhere else. Although not strictly the first step (read our recent post From Data to Knowledge: There and Back Again, to know more about different modeling strategies), at some stage data import comes into play. And of course, a common problem is that there are many different sources. More often than not, datasets differ in structure and representation. Megaladata allows you to import data from various sources — files (excel, text, xml, megaladata file format), databases, data warehouses, business applications, and web services (REST and SOAP). The platform has all the functionality to bring differently structured data to a unified view ready for analysis. Let's look at an example of a Megaladata workflow providing such a consolidation:
Figure 1: Data import
In this workflow, we have imported a pricelist from an excel file, and configured two connections — to an SQL database containing data about discounts, and to a web service providing euro-to-dollar exchange rate (which will be updated daily). We have then used a Calculator component to parse the web service response, and a Column Union node to merge all the imported data into a single table. This table can be now exported into a file or a warehouse, or used for further modeling.
The variety of Megaladata components and features provides scope for customization and integration. To give just a few more examples: Using a REST service and a JSON parser, you can configure import from Google Sheets. Or set up a connection to import information from an Apache Kafka cluster (in the editions Enterprise and Cloud).
Cleaning
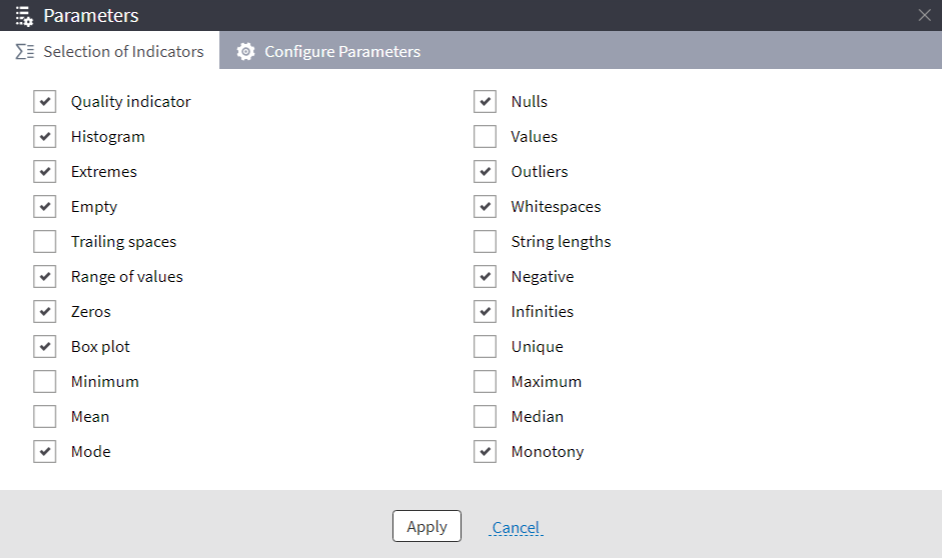
As part of the consolidation process or right after it, you will often have to clean your data. The most common issues that require cleaning include: duplicates, contradictions, missing values, extreme values and outliers, data entry errors, and noise. In our blog, we have explored various data quality issues in a series of articles. See Missing Data Imputation, to start with. Here, we will provide an example to demonstrate some of the Megaladata components and features useful for data cleaning. First of all, the data quality issues need to be determined. Megaladata's Data Quality visualizer is designed specifically for this purpose. In the visualizer, you can choose which parameters are of interest, and configure the methods of their computation:
Figure 2: Data quality indicators
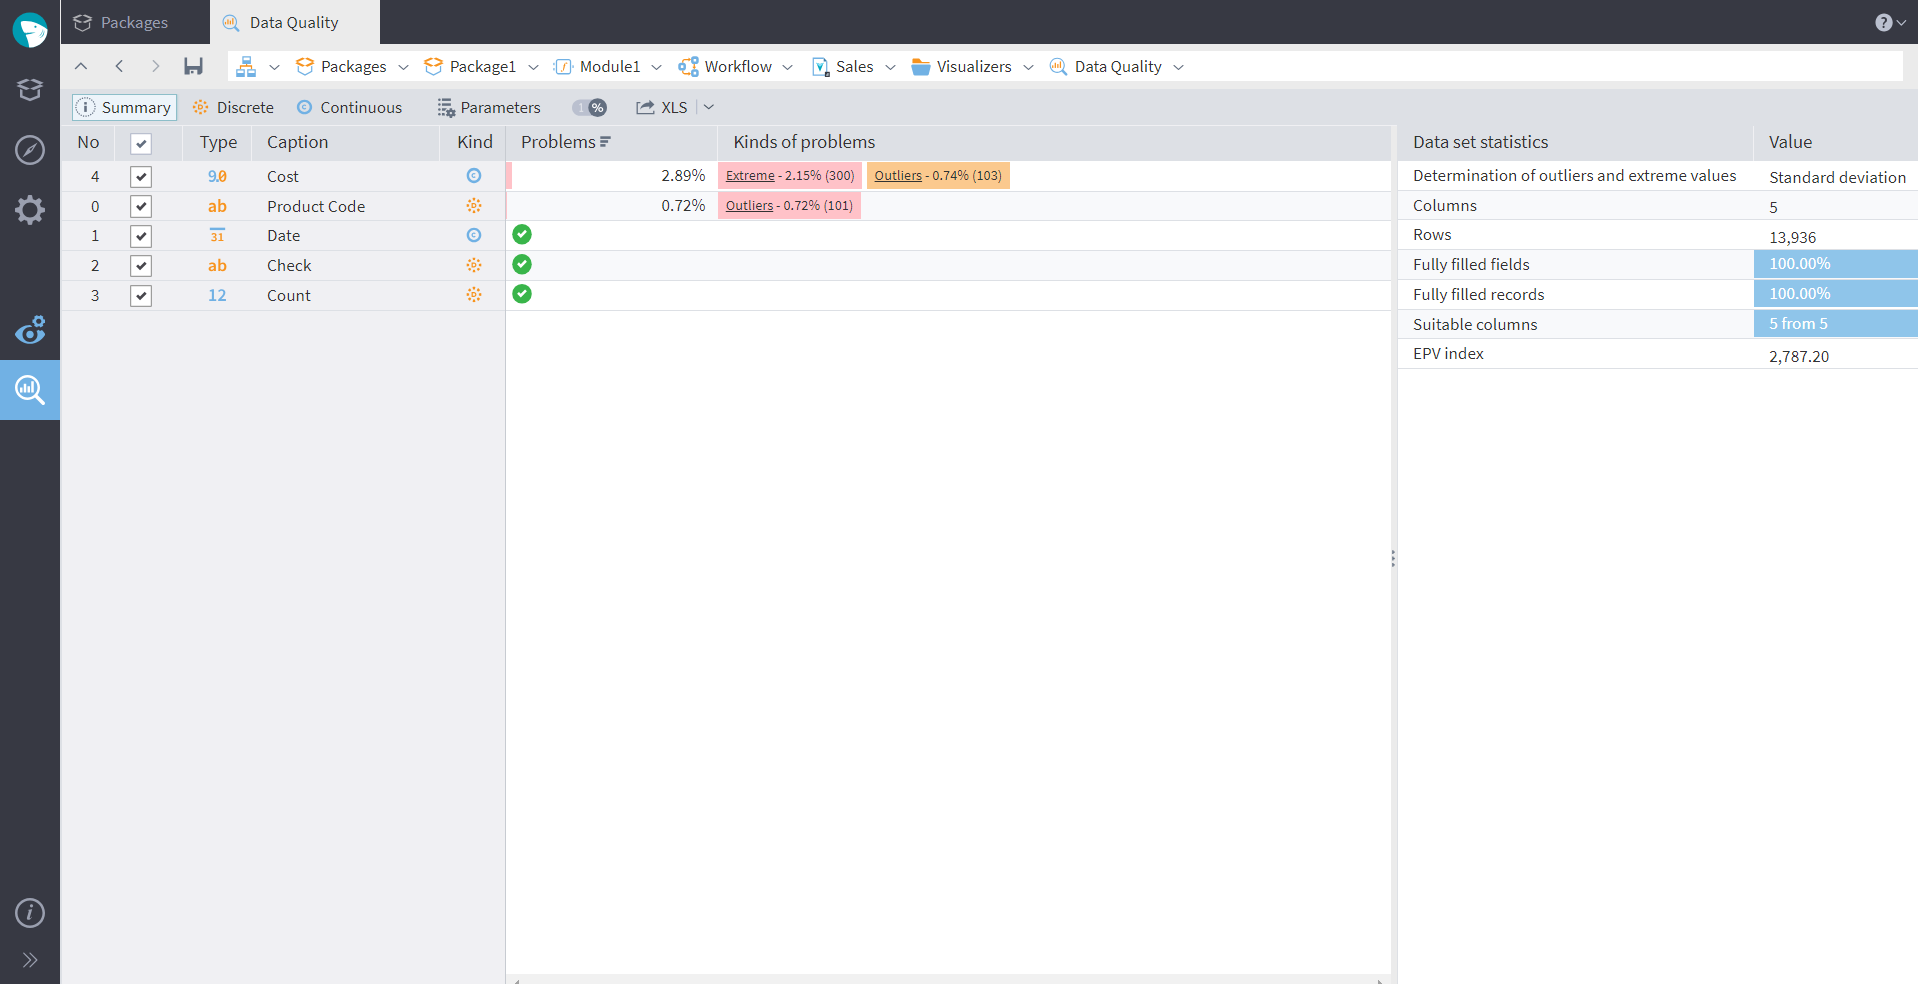
After calculating some indicators, we can see that the dataset we loaded has outliers and extreme values in two columns. The fields with no issues have received the green "Pass" mark:
Figure 3: Data quality visualiser
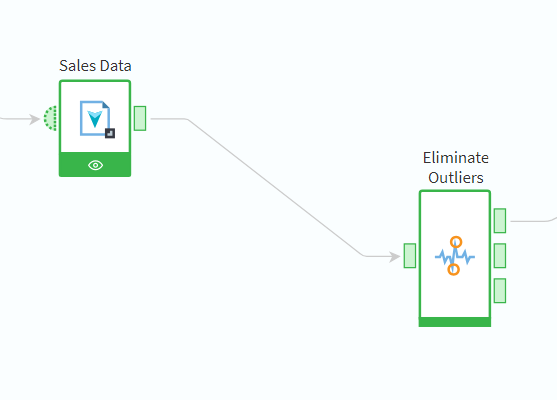
Before proceeding to analysis, we will need to deal with the outliers in our dataset. This is where the component Eliminate Outliers will come in handy. In the configuration wizard of this node, you can choose the way of managing outliers (deleting, replacing with a specified value, etc. — we explore various methods in detail in this blog article). The node will divide the dataset into three (provided in three separate output ports): a cleaned set, a table of outliers, and a table of extreme values. We can now transfer the first table for further processing, and it is convenient to use the other two tables for reference and analysis.
Figure 4: Eliminate outliers node
Handling Duplicates
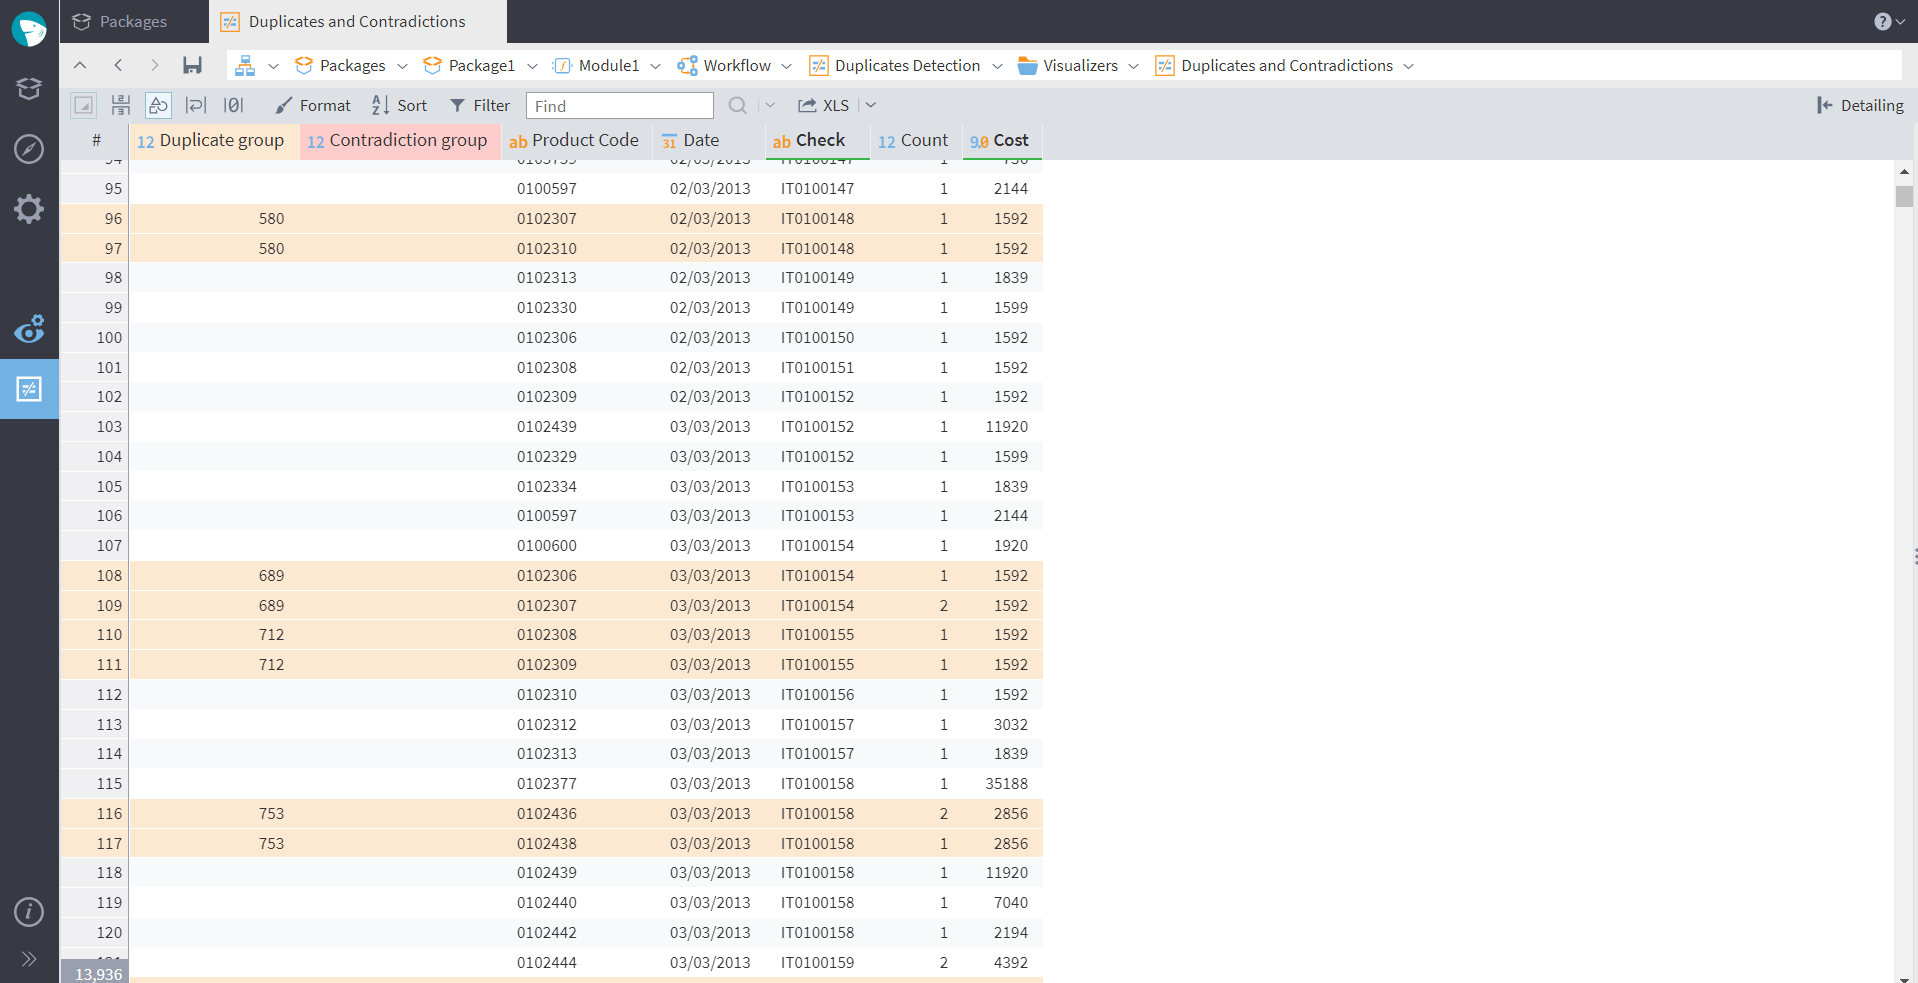
When working with big datasets and especially after merging data from multiple sources, duplicates and contradictions are an extremely typical issue. Sometimes the reasons they appear are incorrect information provided by a client (e.g., a fake phone number) or manual entry errors. Duplicates are records that are repeated completely, while contradictions are records that share the information only in part. In the first case, all the unnecessary copies should be deleted as they take up storage space and don't provide any additional value. Contradictions, on the other hand, may be either errors or real data. For instance, first and last names of two different customers may happen to be the same. The analyst always has to investigate contradictory data further to decide on the proper way of handling. In Megaladata, you can check for duplicates and contradictions in your dataset using the Duplicates Detection component. After you set up the fields for comparison and run the node, you can also configure the Duplicates and Contradictions visualizer, which is available in the duplicates handler only:
Figure 5: Duplicates visualiser
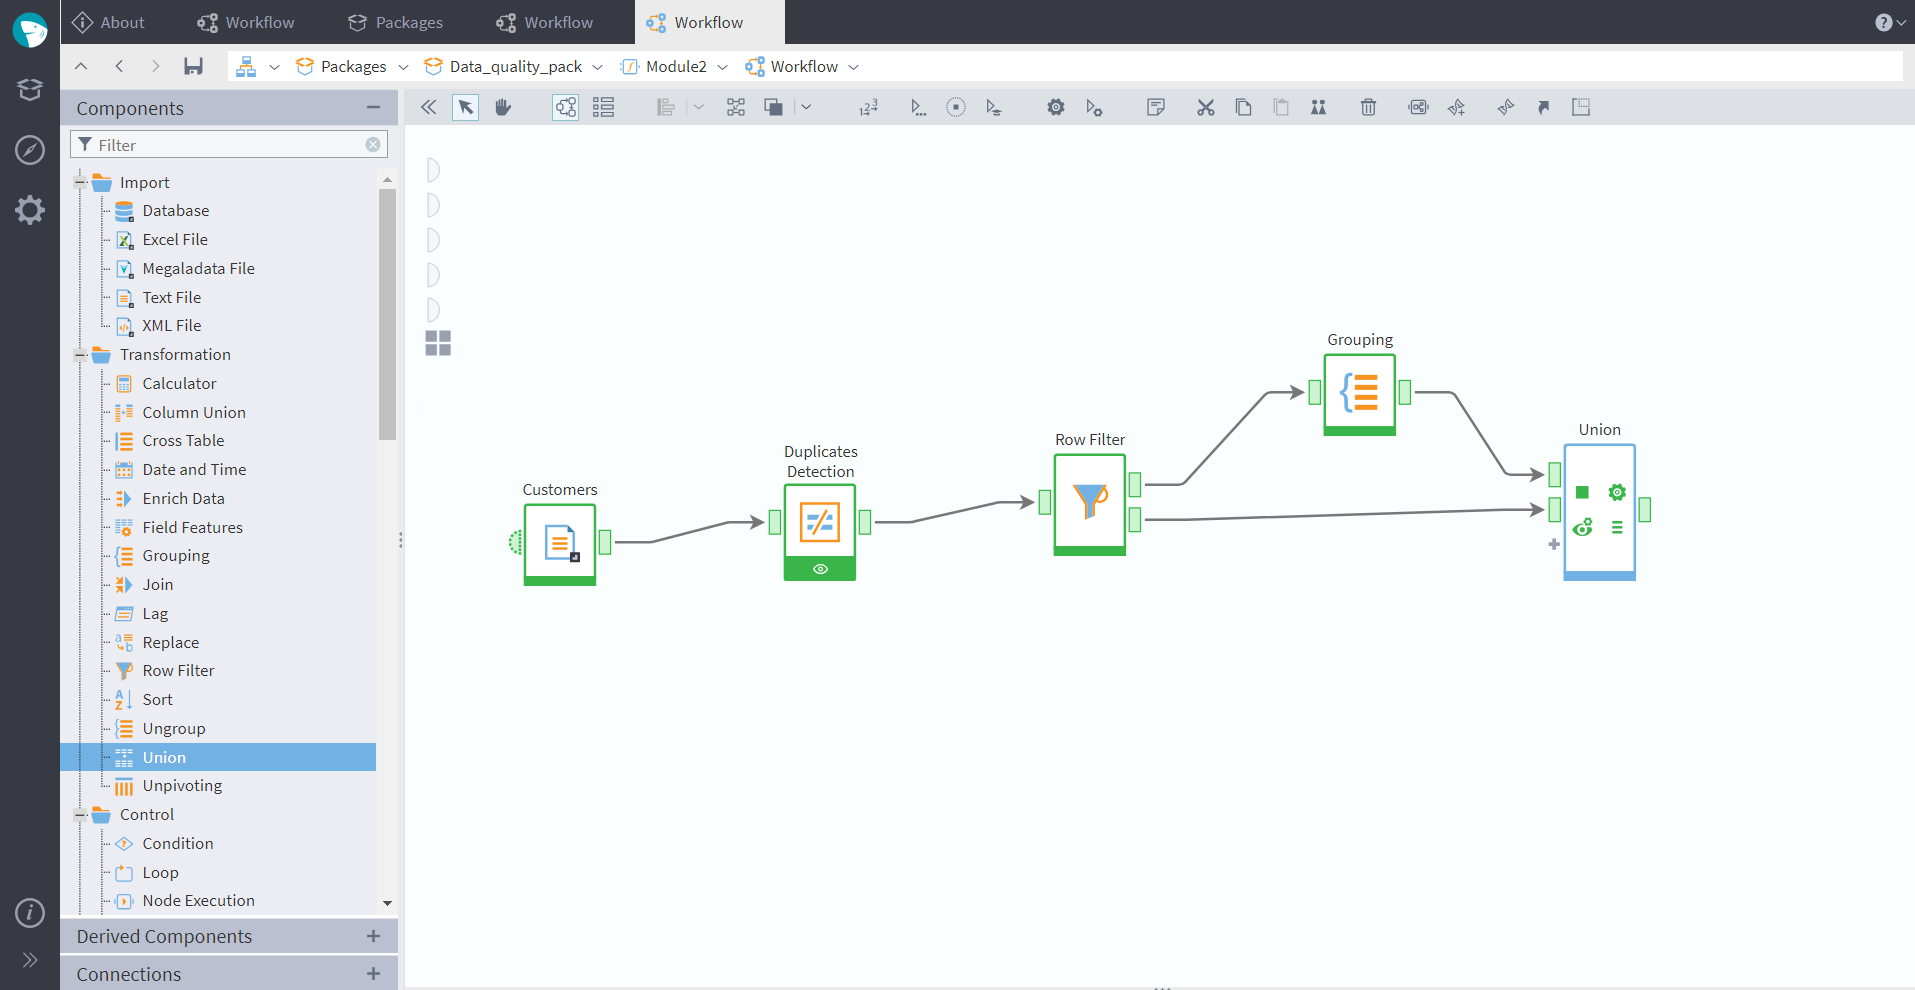
After we have detected the repeating records, we can filter them with a Row Filter, getting two separate tables at the output ports — one will have duplicate records only, and the other one will have only unique records. We then group the duplicate rows in a Grouping node, and add one record of each kind back to our dataset with Union. As a result, we will get a table cleaned of duplicates. An example of such a workflow is shown in the screenshot below:
Figure 6: Duplicates detection
In Conclusion
Import, data cleaning, and deduplication are typical tasks present in everyday work of analysts. To save time and energy, it's crucial to know the functionality of your software and use the "shortcuts" — automation, most convenient representation, real-time connections, etc. — wherever possible. It could be helpful to envelope some models into supernodes, as shown in the example below:
Figure 7: Supernodes
You can place all the workflows made earlier inside such supernodes. As eliminating duplicates is also part of data cleaning process, the supernode with our deduplication model can nest inside the data cleaning supernode (the level of nesting in Megaladata is not limited). What's more, the platform allows creating custom components, which you can add to the library and use later in any of your packages (See derived components). Such reusable workflows are a real boost for productivity, diminishing the amount of routine modeling and releasing your creative energy for new and more thrilling tasks.
See also
