Megaladata 7.3.2 addresses memory leaks and fixes bugs in the Import group components, Calculator, Calculator (Tree), certain сonnections, and the Cluster Profiles visualizer.
Solving Typical Excel Problems Using Megaladata


Excel is a software product that needs no introduction. However, despite its popularity, it has several limitations that create difficulties in solving complex analytical problems. In this article, we will tell you how Megaladata works where Excel fails.
For specialists familiar with Excel, Megaladata can initially present a different learning curve. Unlike Excel, where the table is the central element, Megaladata prioritizes visual design of schematic workflows. This article bridges the gap by outlining common Excel problems and their corresponding solutions in Megaladata. This comparison approach facilitates a quicker grasp of the new tool.
Today, most of the data analysis relies heavily on Excel. The program is so popular that it is included in some school curriculums. Such long-term familiarity with the application might explain why the transition to advanced analytical platforms can be challenging. When first encountering Megaladata, users accustomed to Excel's logic might be expecting familiar tables and graphs and hope to directly apply existing Excel skills. We have written this article to help you overcome any initial confusion.
Switching to a new product built on different principles often requires us to re-learn even basic tasks. The key to quickly getting up to speed in such situations is to capitalize on your existing knowledge, finding similarities between the new product and familiar Excel functions.
This article uses a case study to examine how an Excel specialist learns the basics of a low-code analytical platform. Megaladata is used as the analytical platform.
Download Megaladata Community Edition for free
Business Analysis Scenario: A company sells three categories of goods: office supplies, furniture, and technology. There are different types of buyers: independent customers, corporate clients, freelancers, and small businesses. Sales records are kept and you are required to analyse business dynamics over a number of years.
Data Loading
The work begins with downloading data. There are three ways to get data in Excel:
- Opening a file (file → open)
- Importing from an external source (data tab → get data)
- Entering data manually
Data analysis platforms typically follow a streamlined workflow: import → processing → export, i.e. obtaining information from external sources, performing various transformations and then uploading the results. This chain of operations makes up a processing workflow. Analytical platforms provide little or no tools for manual data entry/editing.
In Megaladata, loading is carried out by means of import from a file or a database (text files, Excel files, xml, internal Megaladata format files, and various databases are supported). To do this, the user needs to add a component from the Import section to the workflow area (in our case, it will be the Excel File component), and specify the path to the file in the component's settings. The data from the file will be loaded into memory.
To view the loaded table, the analyst needs to run the node and double-click on its Output Port. The table will appear in the Quick View window.
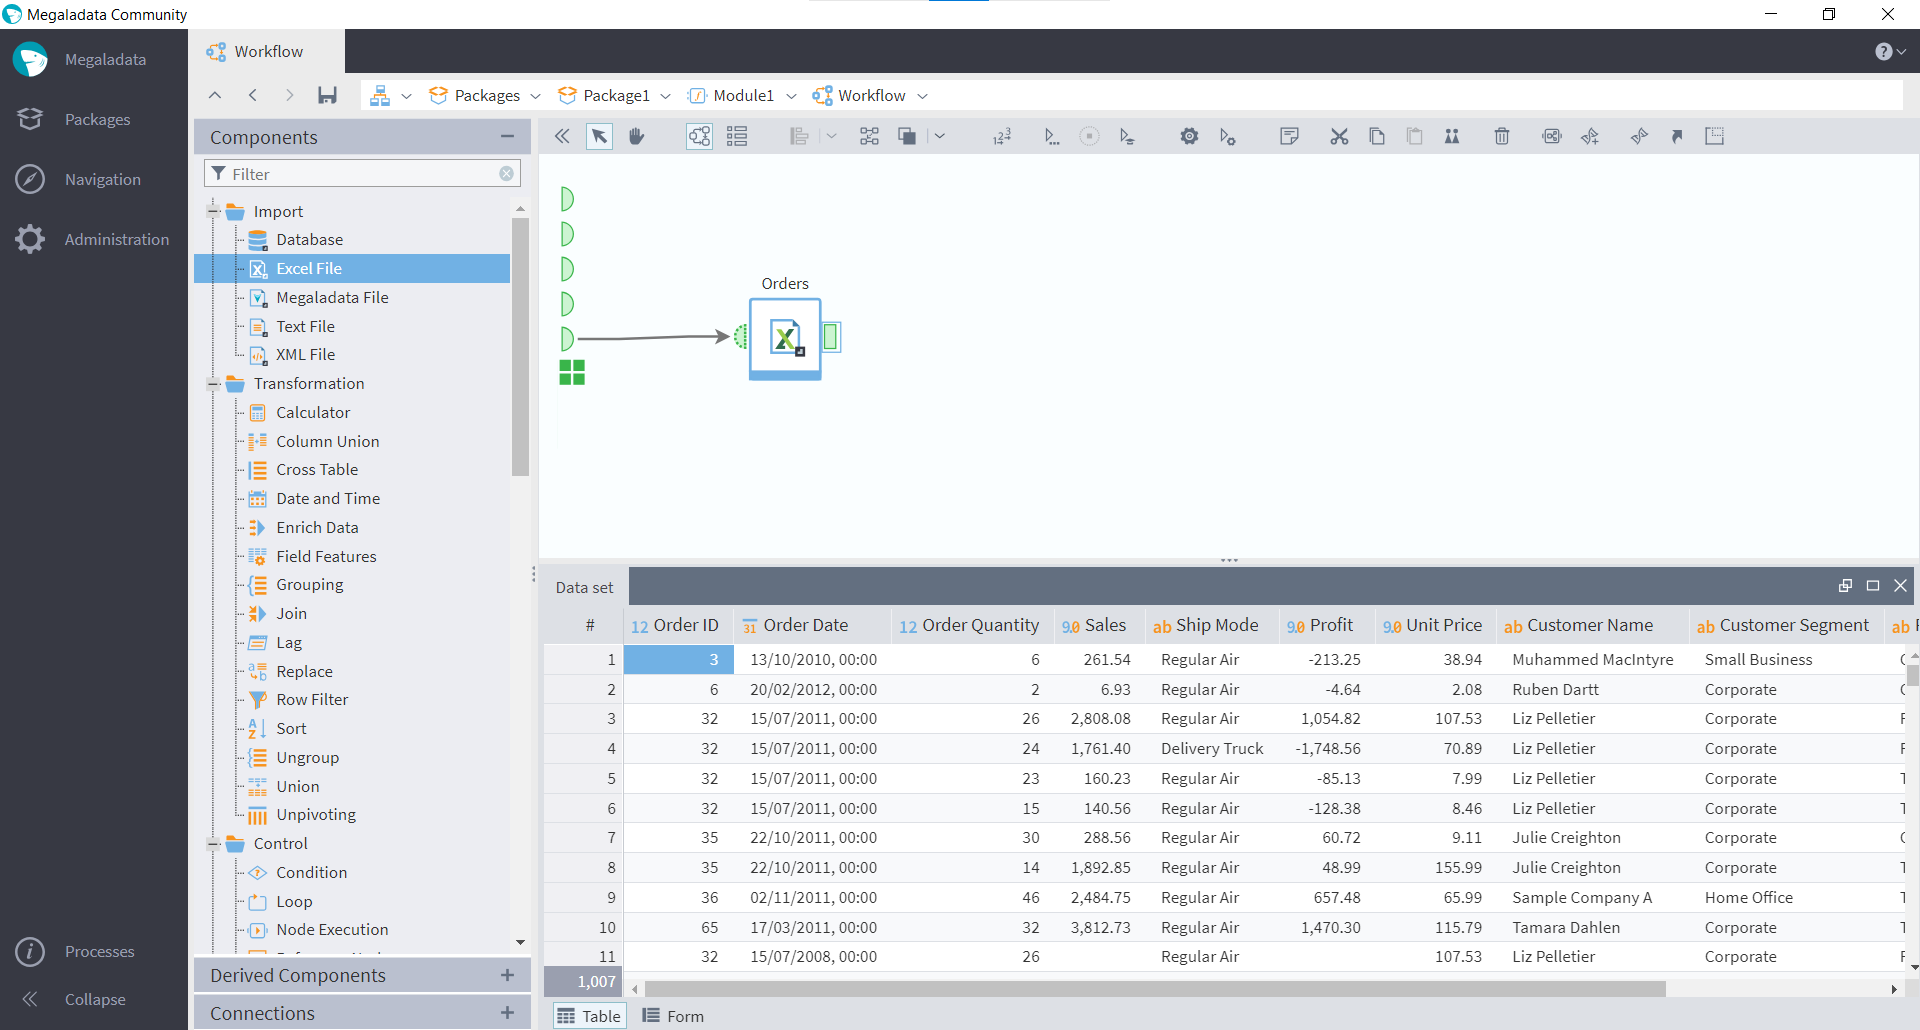
Figure 1: Setting up a workflow
Another way to view the table is to add a Table visualiser. As a result, the table will be displayed in full-screen mode.
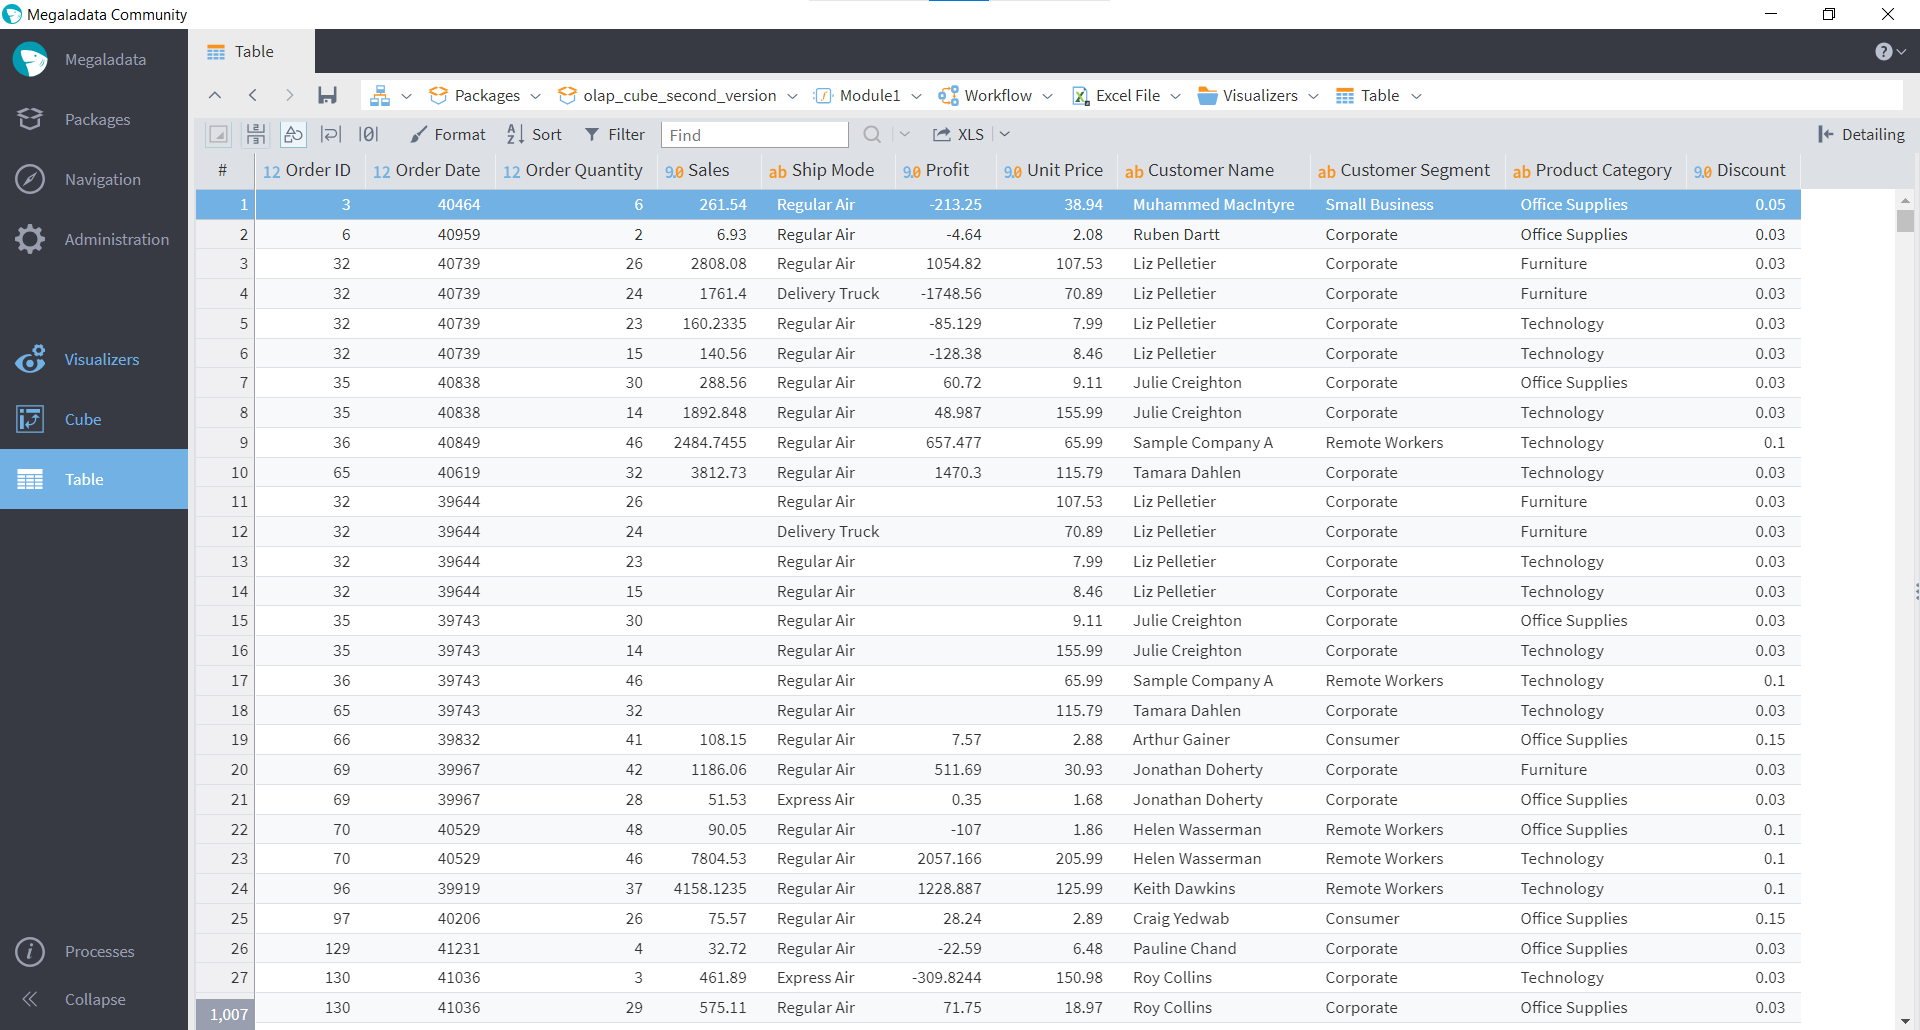
Figure 2: Table visualiser
This visualisation method is suitable for a detailed study of a table using Filters, Sorting, Formatting, etc.
Charting
In Excel, charting starts by selecting the columns of interest in the table and then selecting the chart type. Then the display is set up.
You need to select the desired node and click on the Configure visualisers icon that appears inside it. The Visualizers section opens. Once in it, you need to choose the Chart visualiser from the menu and drag it to the target box. Entering the box, you can create a chart to display the data.
Choose necessary fields and drag them onto the charting area. Any of the fields can be designated as the X axis. Charts come in various types (line, area, spline, bubble, etc.) and are customizable with colors, line sizes, and markers. Axes can be titled and formatted (linear, logarithmic, date/time). Megaladata's charting features resemble those found in Excel.
The figure shows a bubble chart, where the X axis is the Sales field and the Y axis is the Profit field. The sizes of the bubbles are determined by the Unit Price.
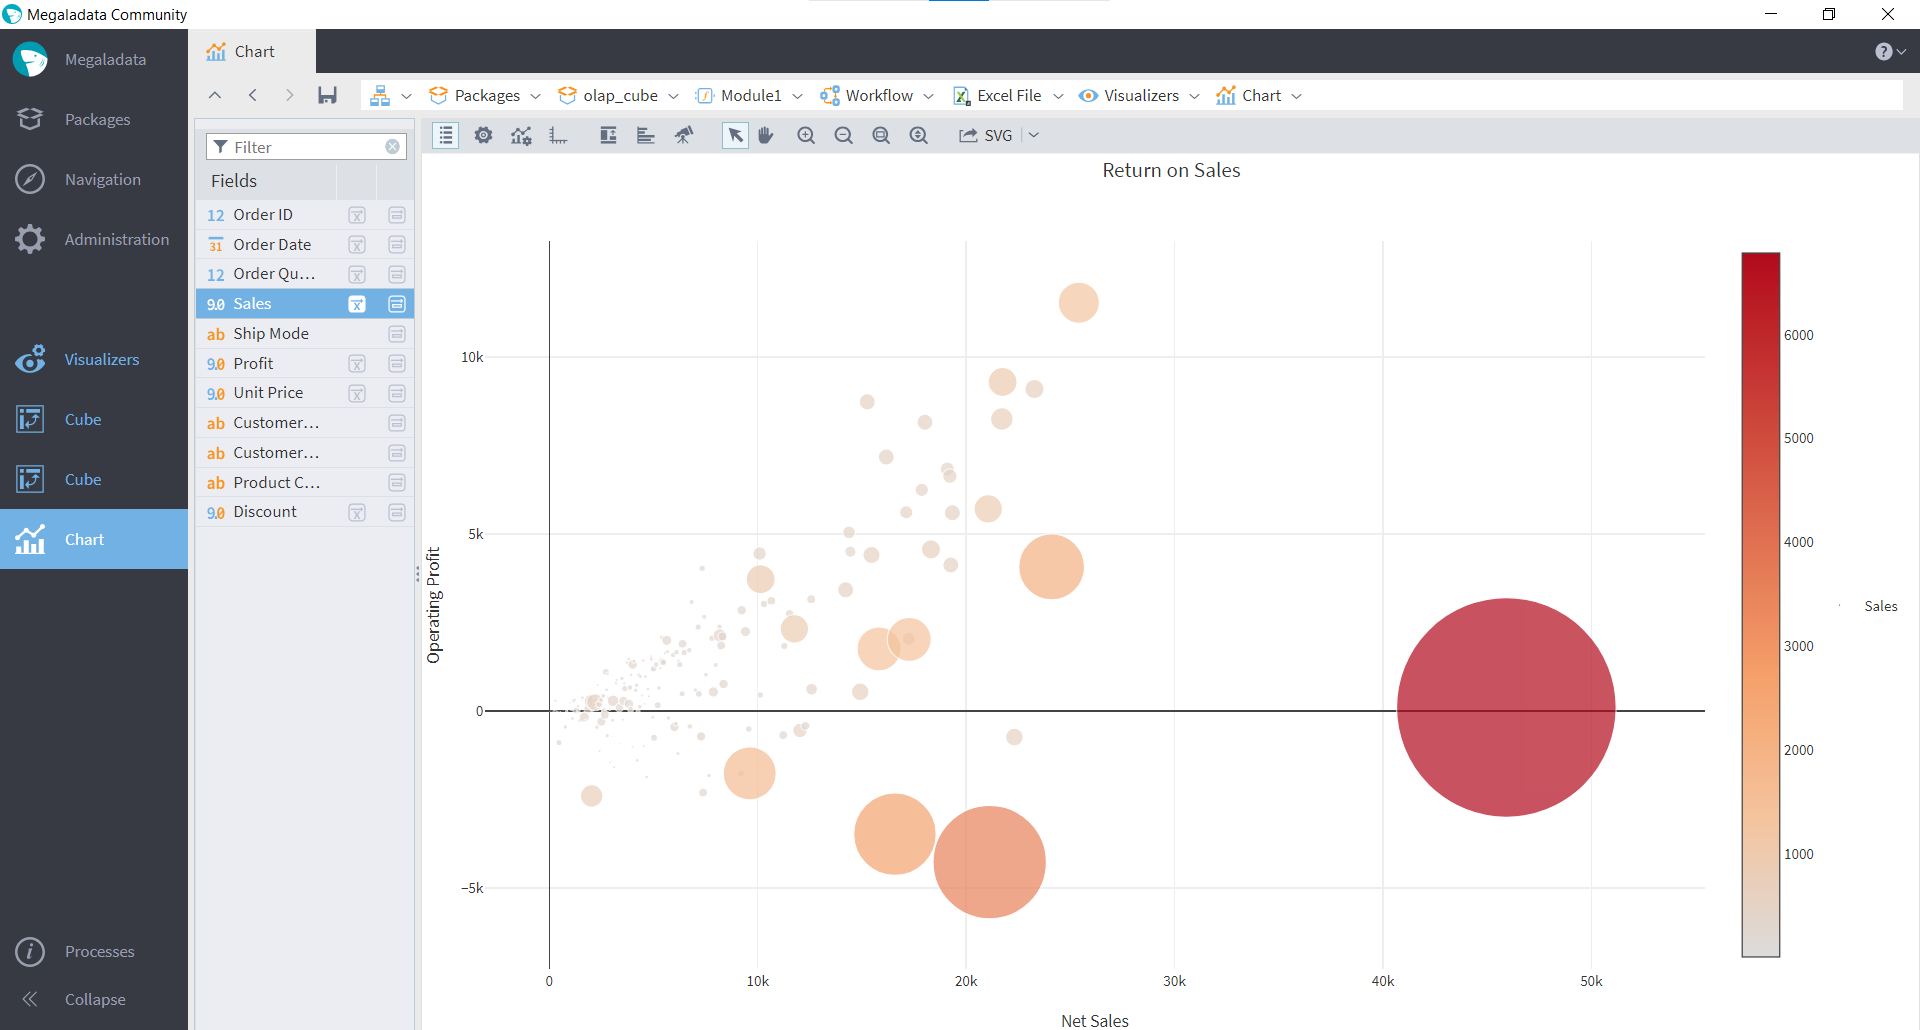
Figure 3: Bubble chart
Performing simple operations
A simple task of determining the operating margin (a profit-to-revenue ratio) in Excel is done by setting a formula in a cell and dragging it down. In Megaladata, a special component called Calculator is used for this purpose. In it you can use the same functions as in Excel: string, mathematical, statistical, logical and others.
After adding the Calculator node to the workflow, the user will need to specify an expression for the field to be calculated in the wizard. Megaladata Calculator formulas can be written almost the same way it is done in Excel, although the “=” sign is not needed at the beginning.
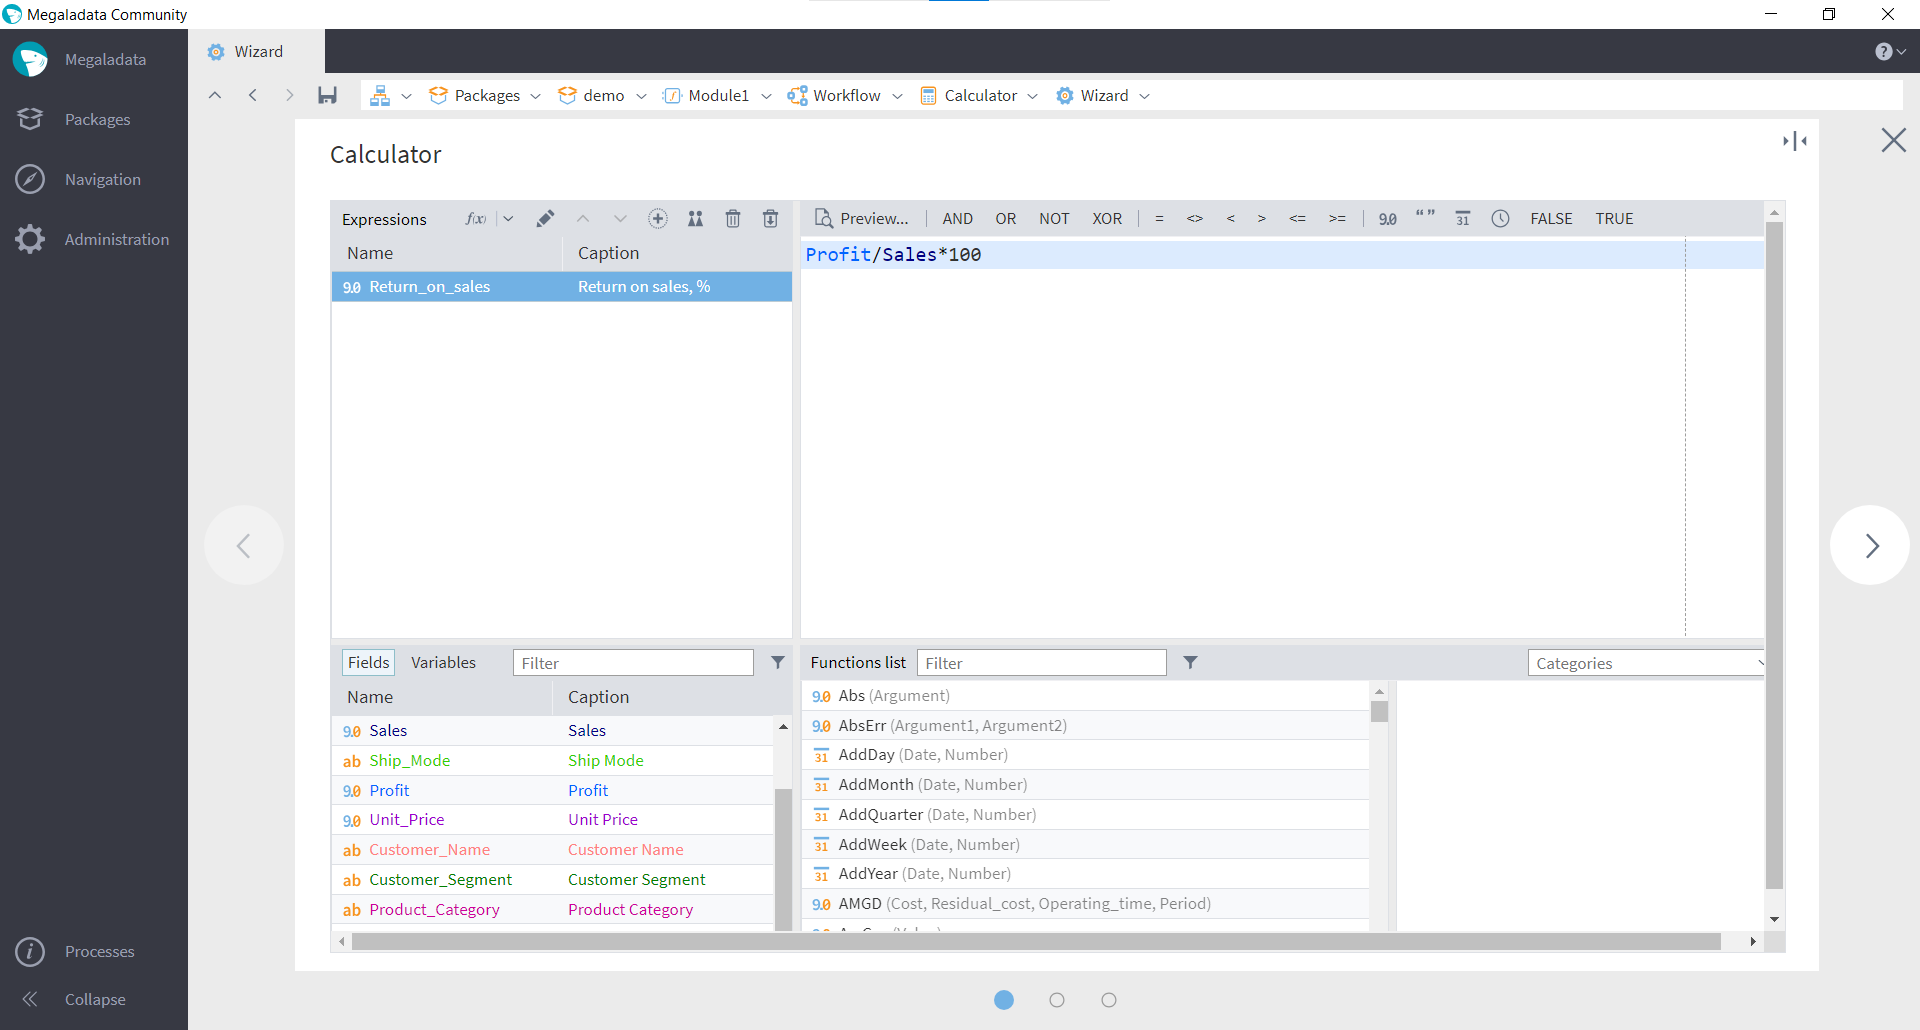
Figure 4: Setting up the Calculator Node
After executing this node, a field called "Return on sales, %" will appear in the resulting table. This is where the operating profit margin will be calculated.
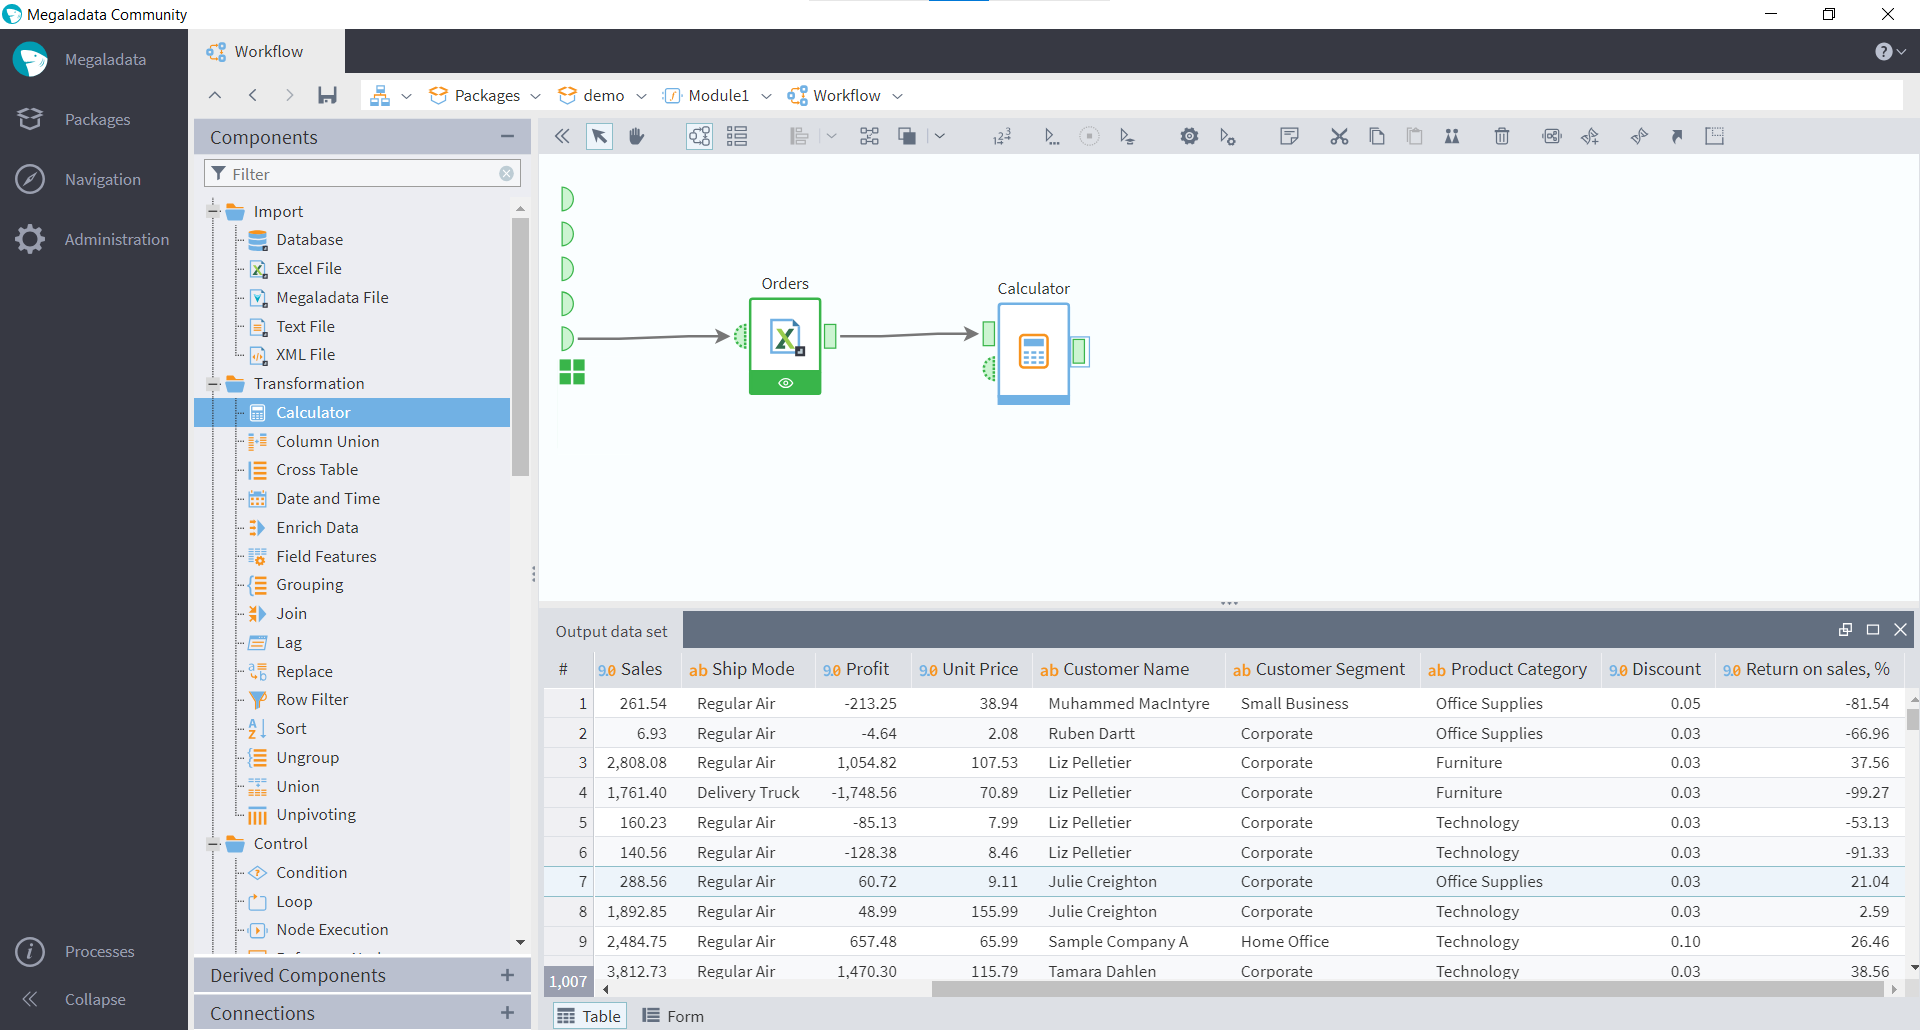
Figure 5: Adding the Calculator Node
You can learn more about building a Megaladata workflow from the video.
Calculator is one of the most commonly used components in Megaladata. It implements not only most of the functions found in Excel, but also many others, for example, functions operating regular expressions.
Pivot tables
A powerful tool for exploring data in Excel are pivot tables. They are designed to summarise information on key fields and present it in various forms (example in the figure below).
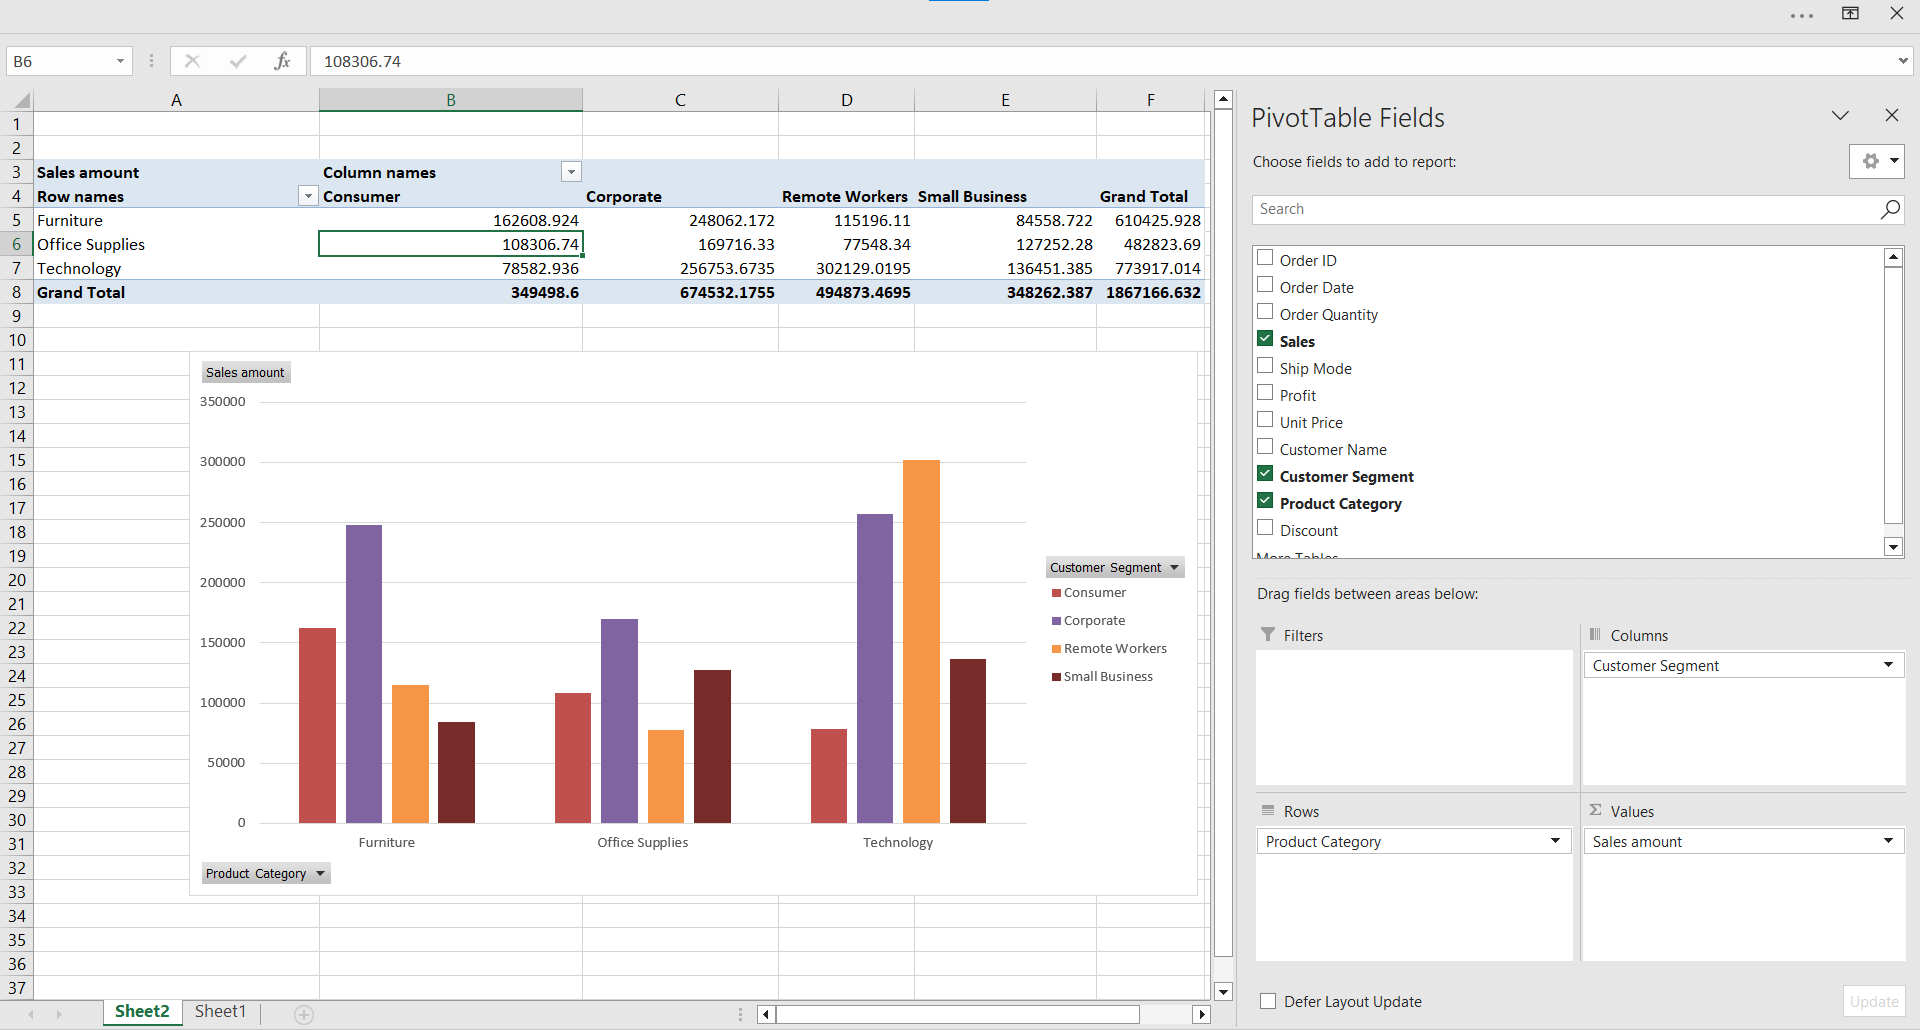
Figure 6: Pivot table in Excel
The analogue of pivot tables in Megaladata is the OLAP cube. The user can build it for any of the nodes they add to the workflow by clicking the visualizers icon in the node and choosing the Cube option.
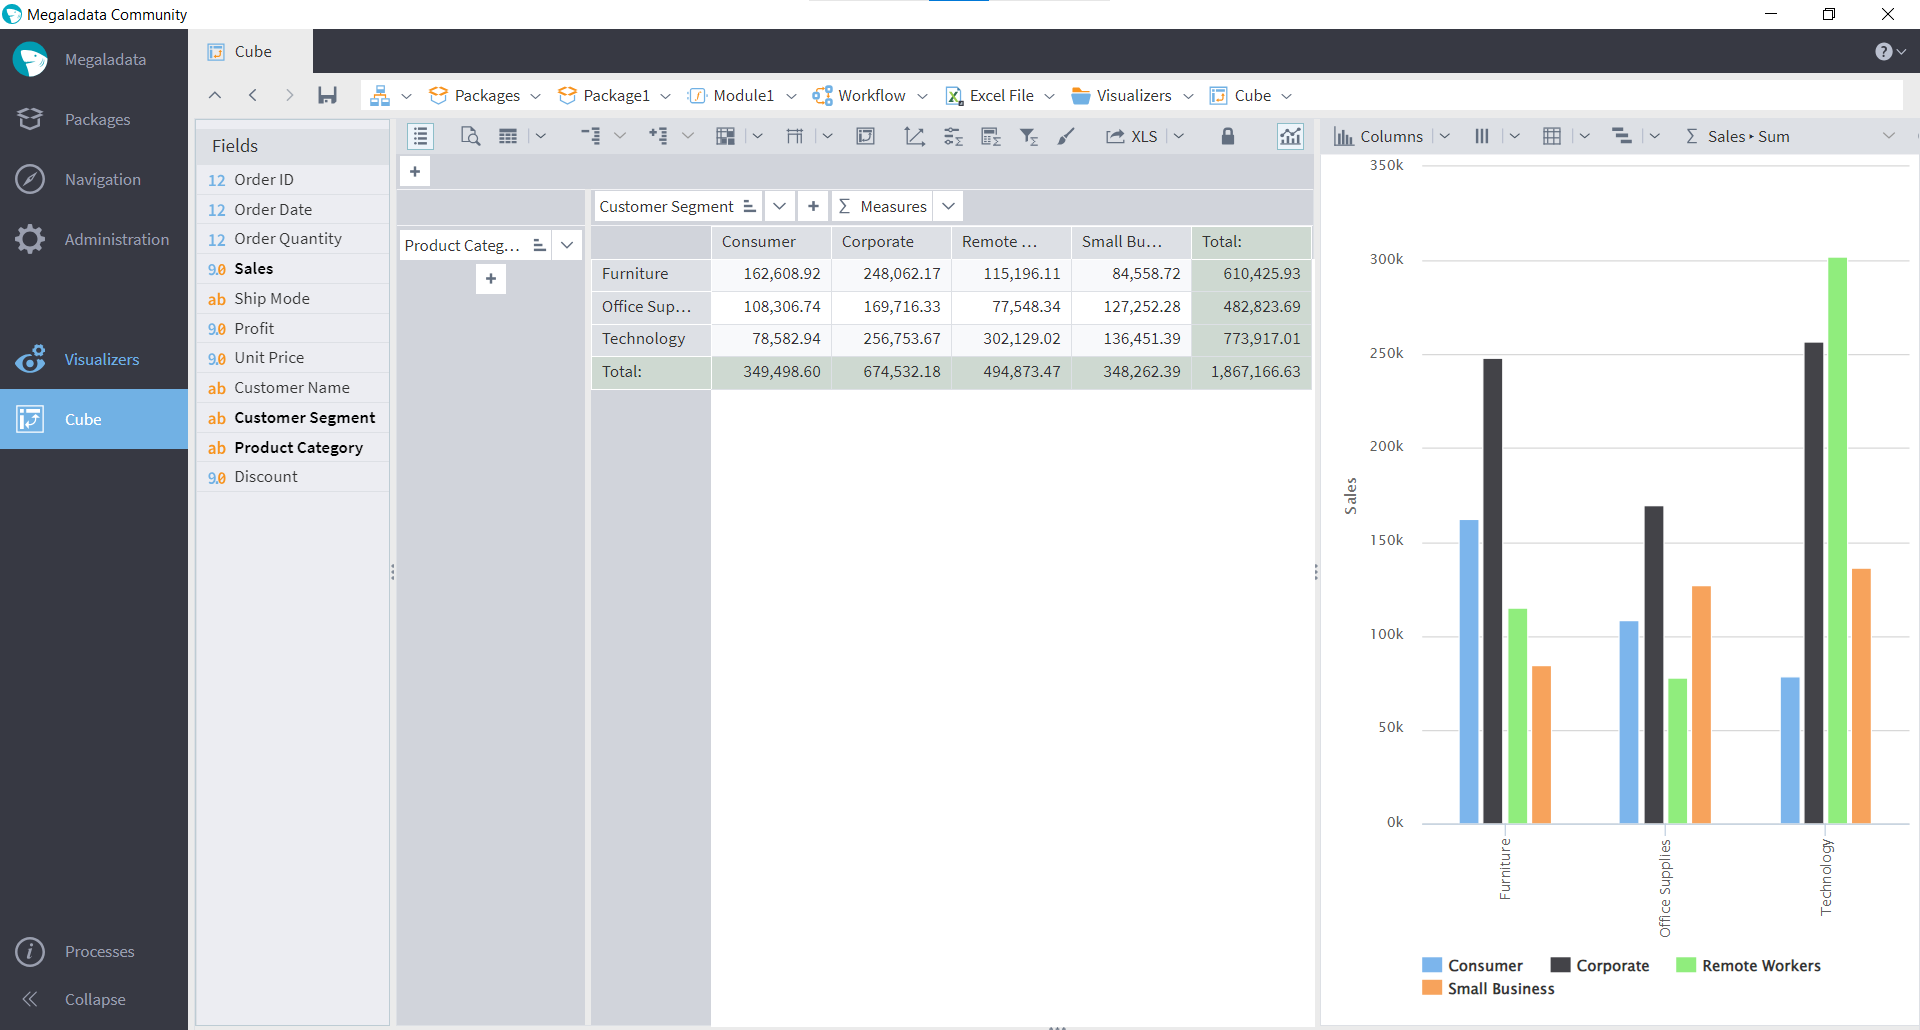
Figure 7: OLAP cube in Megaladata
It is also possible to view the cube as a chart and see details for a selected cell. The buttons corresponding to these tools are highlighted with red squares in the figure. The figures above demonstrate that the results of the Excel pivot table are identical to those obtained in Megaladata.
It is worth noting that in Megaladata, cubes and charts can be built for any workflow node at any processing stage.
Merging tables
When working with data, it is often necessary to merge tables based on key fields. Specifically, in the example under consideration, there is a table of discounts (Discount sheet), where for each customer segment the amount of discount is defined. We want to merge this information with another table, "Orders," to add a discount coefficient for each customer segment in the order data.
In Excel, this operation is performed with the help of the VLOOKUP function. To add values from one table to another, you need to select the cell you want to compare, the table to find the necessary values in, and the search column. You can read more about the function in the Excel documentation.
Megaladata offers a user-friendly way to achieve the same result: you only need to add a Join node to the workflow and configure it, setting the join type (in our case, Left Join) and the fields to be linked ("Customer Segment").
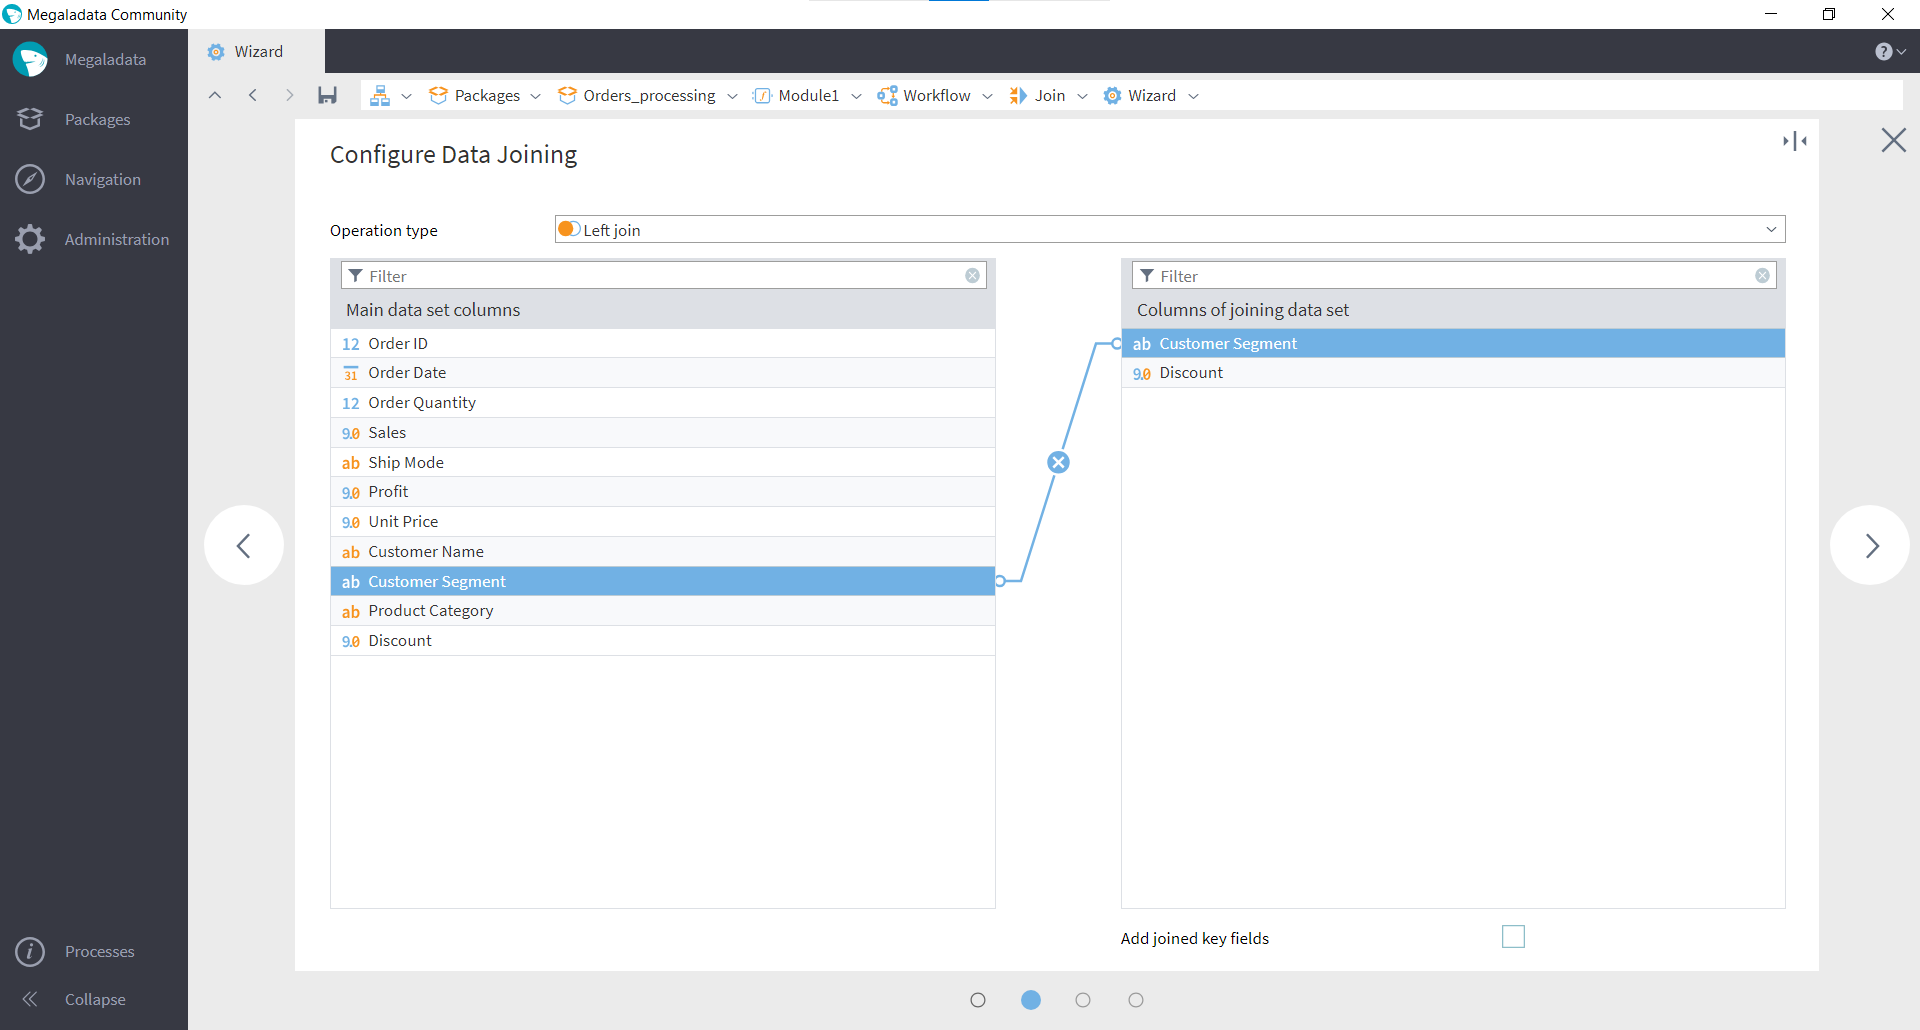
Figure 8: Joining
The program will create a table with the "Discount" field attached.
This approach greatly simplifies the understanding of the processing logic, which is a strong point of analytical low-code platforms: the processing workflow is understandable not only to its author, but also to anyone who knows low code.
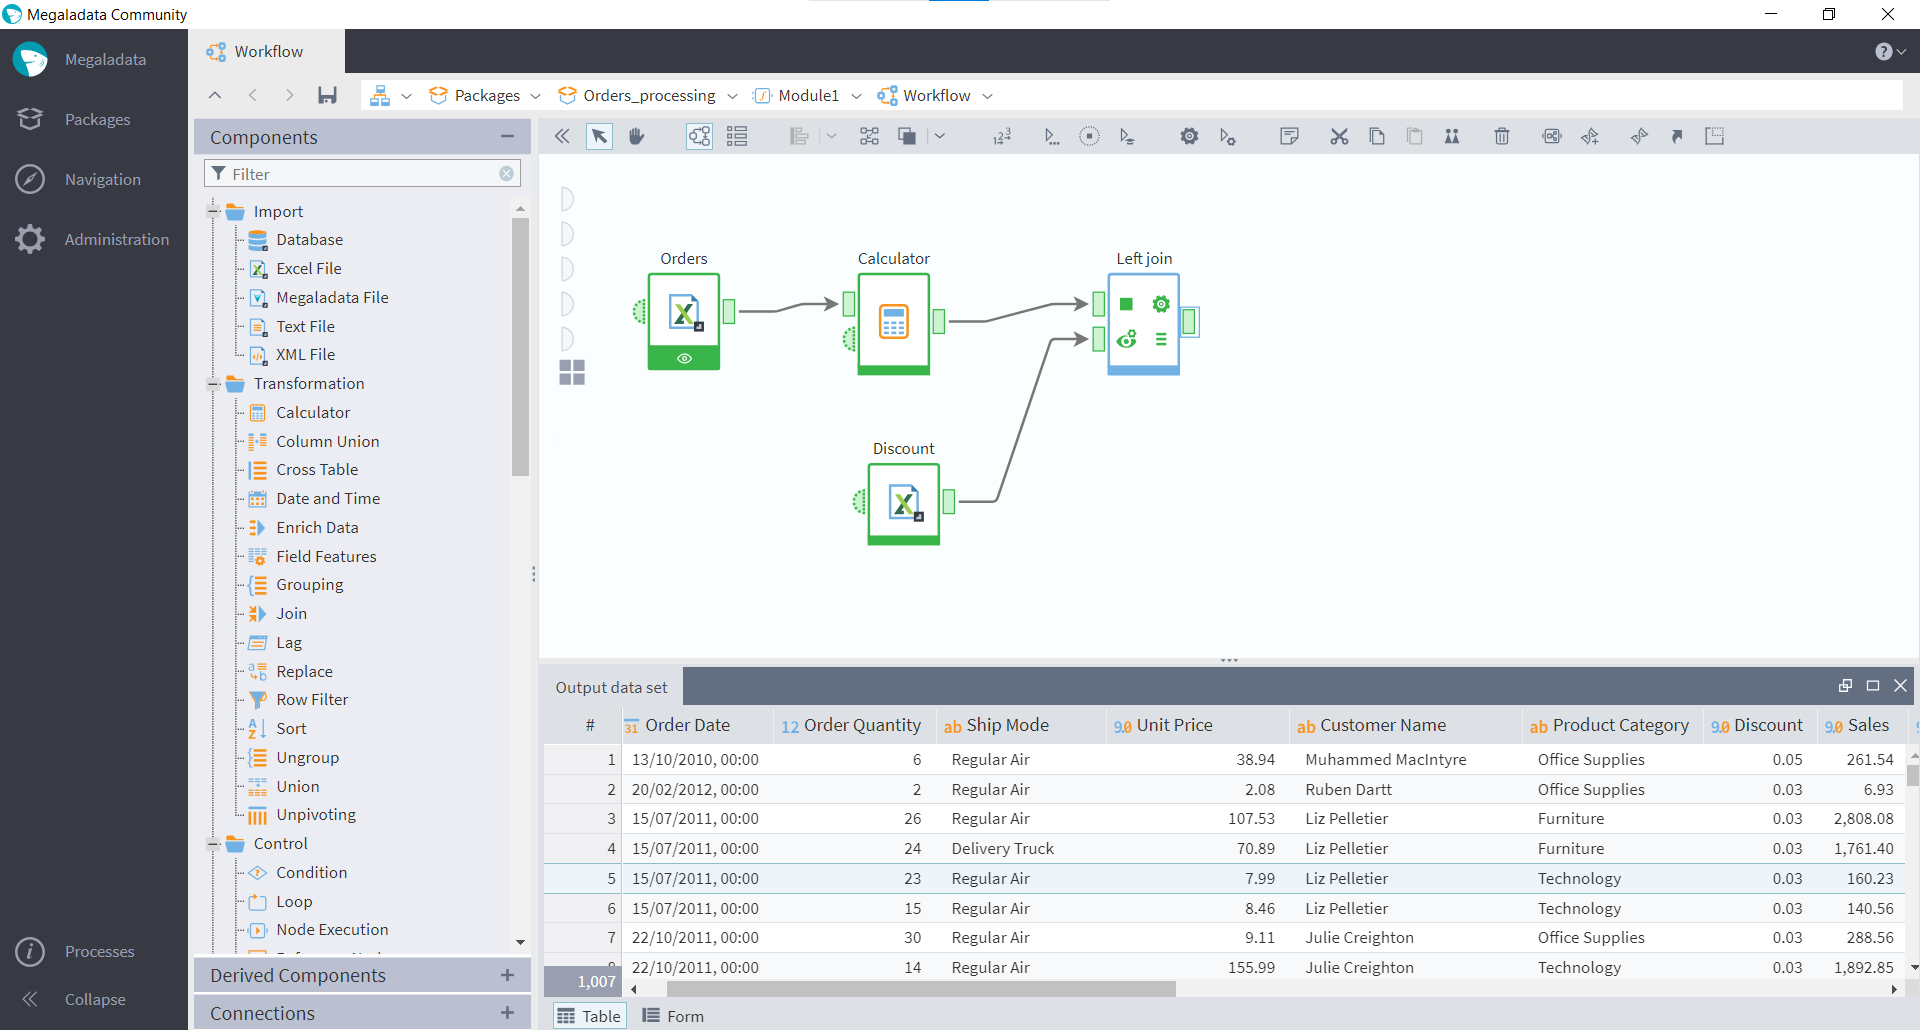
Figure 9: Adding the Join node to a workflow
Conclusion
As already mentioned, tables are just one form of data representation. Unlike Excel, where the main object of the user interface is the tables themselves, in analytical low-code platforms it is the Workflow. This paradigm allows to operate tabular data interactively with the help of blocks called Nodes and links between them.
Compact representation simplifies the perception of processing logic, which in turn allows you to create more complex workflows which include joining tables, transposition, grouping, sorting, loops, etc. When needed, you can display your data in form of tables or charts.
A significant difference between Excel and Megaladata is that the analytics platform, unlike an office application, is designed to automate processing, where once written a script can then be applied to a new data set. In addition, the low-code platform is capable of processing samples of hundreds of millions and even billions of rows, which is far beyond the capabilities of Excel.
Comparison of the basic functionality of Excel and Megaladata:
| Excel | Megaladata |
|---|---|
| File → Open | Components of the Import section |
| Data → Receiving external data | Components of the Import section |
| Manual data entry | — |
| Operations on cells | Calculator Component |
| Data → Filter | Row filter Component |
| Data → Sort | Component Sort |
| Function VLOOKUP | Component Join |
| Select fields → Insert → Chart | Section Visualizers |
| Pivot table | OLAP cube |
In practice, analysts often use Excel for primary data analysis and editing, where possible, and then import the edited file into the analytics platform for further processing. The final step is to export the data, and often, the results get uploaded back to Excel, as it remains one of the most popular software applications among data analysts.
See also

Megaladata 7.3.2 - Release Notes

MCP Server in Megaladata: From AI's "Smart" Answers to Real Business Solutions
AI doesn't make mistakes. It's just given the wrong data. Even the most powerful models are useless without quality, properly prepared context. Megaladata's MCP server transforms AI from a generic...

Megaladata at Telecom Week Armenia
On March 24-25, Megaladata participated in Telecom Week Armenia 2026, a series of sector-focused events bringing together telecommunications operators, government representatives, regulators, technology...
About Megaladata
Megaladata is a low code platform for advanced analytics
A solution for a wide range of business problems that require processing large volumes of data, implementing complex logic, and applying machine learning methods.
GET STARTED!
It's free