On July 17-19, 2026, Megaladata took part in e-Logi Fest 2026, Armenia's leading international event dedicated to logistics, e-commerce, and supply chain innovation.
Optimizing Technological Processes of a Steel Mill


Megaladata's pilot project at a major steel mill. The project confirmed the possibility of processing large amounts of data and building a quality model for heavy industry using the low-code Megaladata platform.
The project described below was meant to answer the question: Is it possible to develop a high-quality solution for finding optimum performance modes of an electric arc furnace, and design a "digital advisor"?
Our customer was a major steel mill, one of the world's leading metal manufacturers. The enterprise integrates all production steps, from iron ore mining to the production of ferroalloys.
Situation before the start
The plant employed electric arc furnaces. An automated control system supported the furnaces' optimum performance by controlling the actuators, with the goal of reaching the reference performance. The data on each component's operation mode was recorded in a database every ten seconds.
The mill's engineers classified 18 types of technological disruptions in the normal furnace operation. Each disruption resulted in increased power consumption and lower output quality or quantity. Multiple combinations of various destabilizing factors could lead to a furnace malfunction.
For example, the speed of smelting and power demand depended on the metal charge composition, electrode placement and use, and 200 other parameters. Achieving the best operation mode was complicated by the high time lag of charge descent.
Overall, to achieve optimal performance, the automated control system was often supplemented with manual intervention by the mill's specialists and technicians in the process of furnace operation.
The enterprise had its standards for optimal performance parameters. However, equipment wear, the complexity of assessing the impact of multiple factors, and a lack of forecasts for certain situations and their consequences often prevented the mill's specialists from making successful decisions that would help meet production targets.
Goals and objectives
The main goal of this pilot project was to develop recommendations on controlling the electrical characteristics of smelting depending on known charge composition. Solving this problem involved two tasks:
-
To detect dependencies between the electric operation modes of the smelting process and external factors, and create a digital twin of the furnace's electric mode.
-
To build a model describing how the smelting process depends on the charge mix and the speed of its discharge to the smelt zone. Using this model, determine a set of parameters for the control of actuators, which would allow achieving the reference smelting time.
The results obtained would be used to correct the control system patterns and minimize technological disruptions.
Solution
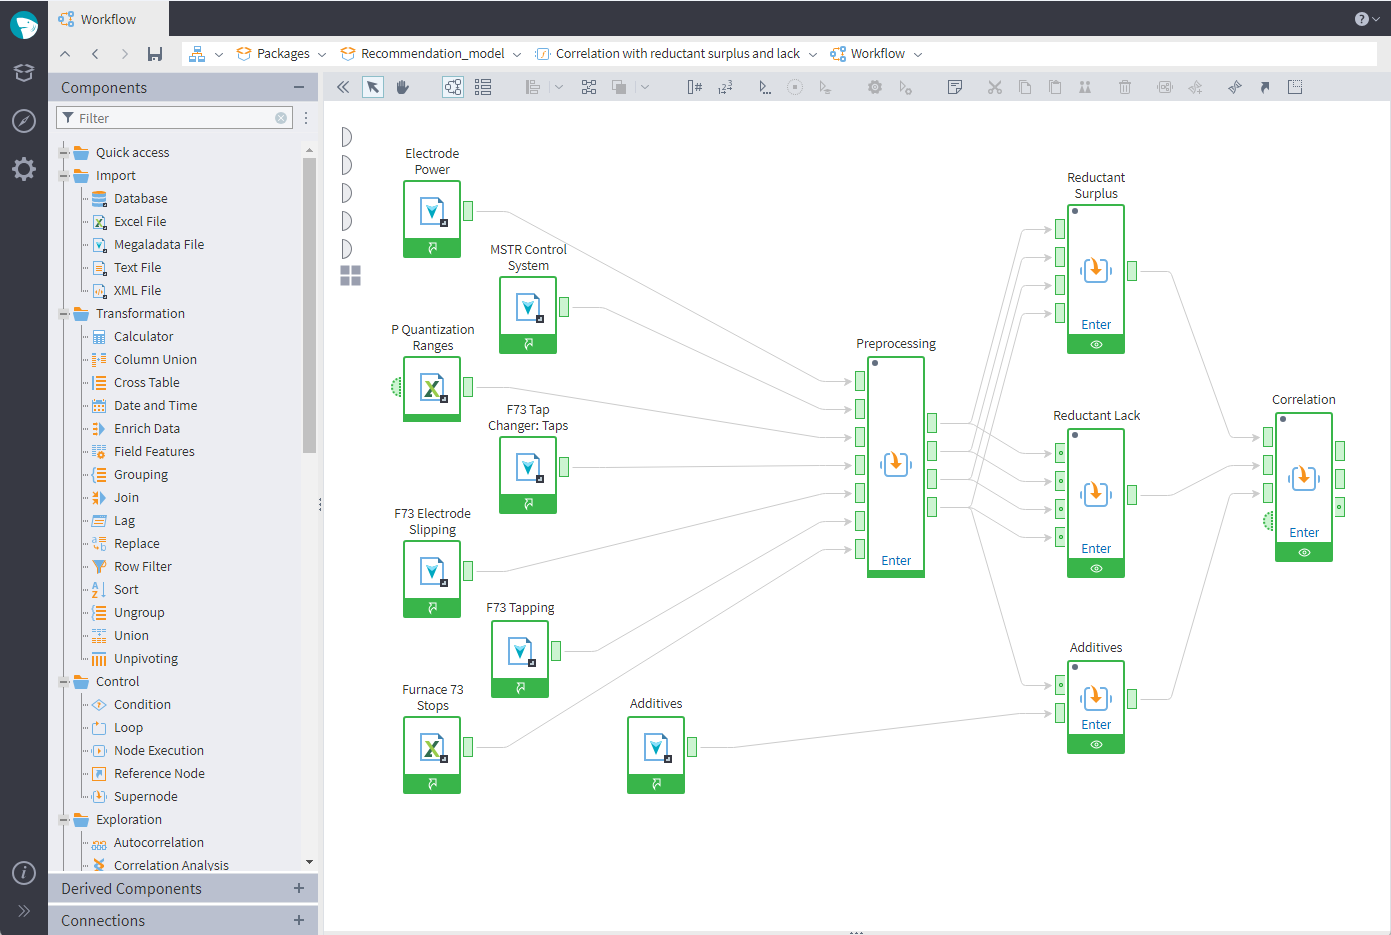
The problem was approached using the low-code Megaladata platform. Since discovering patterns in furnace behavior was an uncommon and challenging task, we had to build the workflow from scratch.
The first stage involved analyzing raw data and noise in search of dependencies that impacted the furnace performance. Of all the 18 technological disruption types, we chose to analyze two types:
- surplus of reducing agent
- lack of reducing agent
These technology disruptions typically resulted in:
- changes in the current load
- electrode destruction (in some cases)
- bottom build-up
- power loss
Should the identified dependencies between the charge composition and the smelting process parameters prove to be strong and statistically significant, we would move on to the second stage: develop recommendations on controlling electric smelting parameters.
Project implementing stages
To detect patterns in such technology disruptions as reducing agent surplus and lack, we analyzed control parameters over one year and a half. For each parameter, historical data consisted of about 900 million records.
| Source Table | Field | Type of Data | Value | Attribute |
| MSTR_73_EL | MSTR_F73W_VAL0 | digital | 8 | Active power of the furnace |
| MSTR_73_EL | MSTR_F73I_ELECTRODE1_V0 | digital | 8 | Electrode current, phase A |
| MSTR_73_EL | MSTR_F73I_ELECTRODE2_V0 | digital | 8 | Electrode current, phase B |
| MSTR_73_EL | MSTR_F73I_ELECTRODE3_V0 | digital | 8 | Electrode current, phase С |
| F73_EL | F73I_A_V0 | digital | 8 | Electrode current, phase A |
| F73_EL | F73I_B_V0 | digital | 8 | Electrode current, phase B |
| F73_EL | F73I_C_V0 | digital | 8 | Electrode current, phase C |
| F73_ST | MSTR_F73I_ELECTRODE1_ON_V0 | digital | 1 | Electrode 1 control, aut/man |
| F73_ST | MSTR_F73I_ELECTRODE2_ON_V0 | digital | 1 | Electrode 2 control, aut/man |
| F73_ST | MSTR_F73I_ELECTRODE3_ON_V0 | digital | 1 | Electrode 3 control, aut/man |
| F73_REPORT | F73_ACC_ACT_P_SHF1_V0 | digital | 8 | Shift 1 power use |
| SPEC1_F73_GAS | F73SPEC_CO2_CLEAN_GAS_V0 | digital | 8 | SPEC1F73 CO2 concentration in clean gas |
| F73_TAP | F73A_TAP_SENSOR_INT_V0 | digital | 8 | Tapping sensor intensity |
Table 1. Input parameters (fragment)
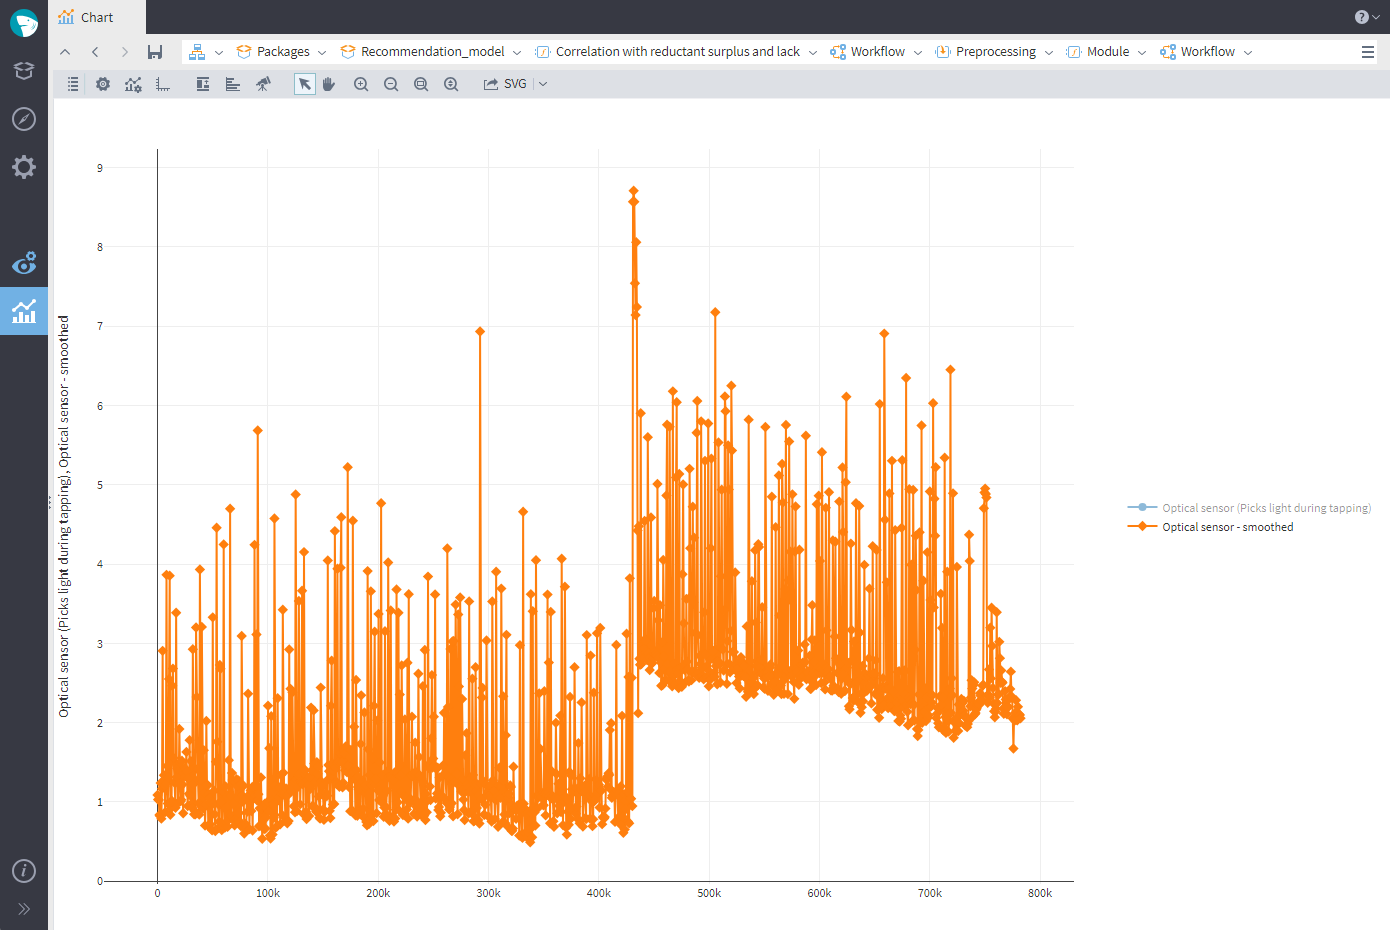
Data cleaning
Before searching for correlations, the data was preprocessed and cleaned:
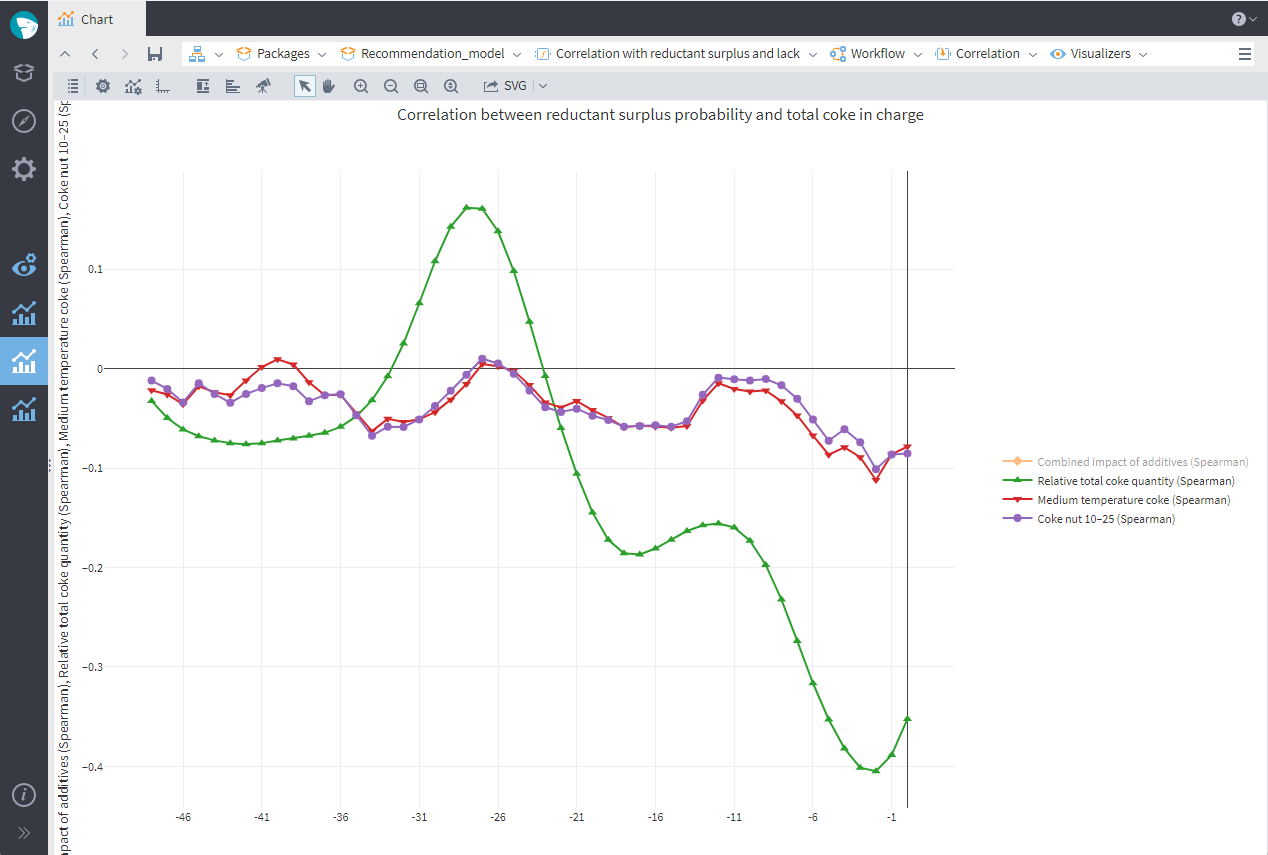
Analyzing data
The analysis revealed a correlation between the occurrences of reductant surplus and lack and inserting additions to the charge mix. The time lag between the events was 26–28 hours.
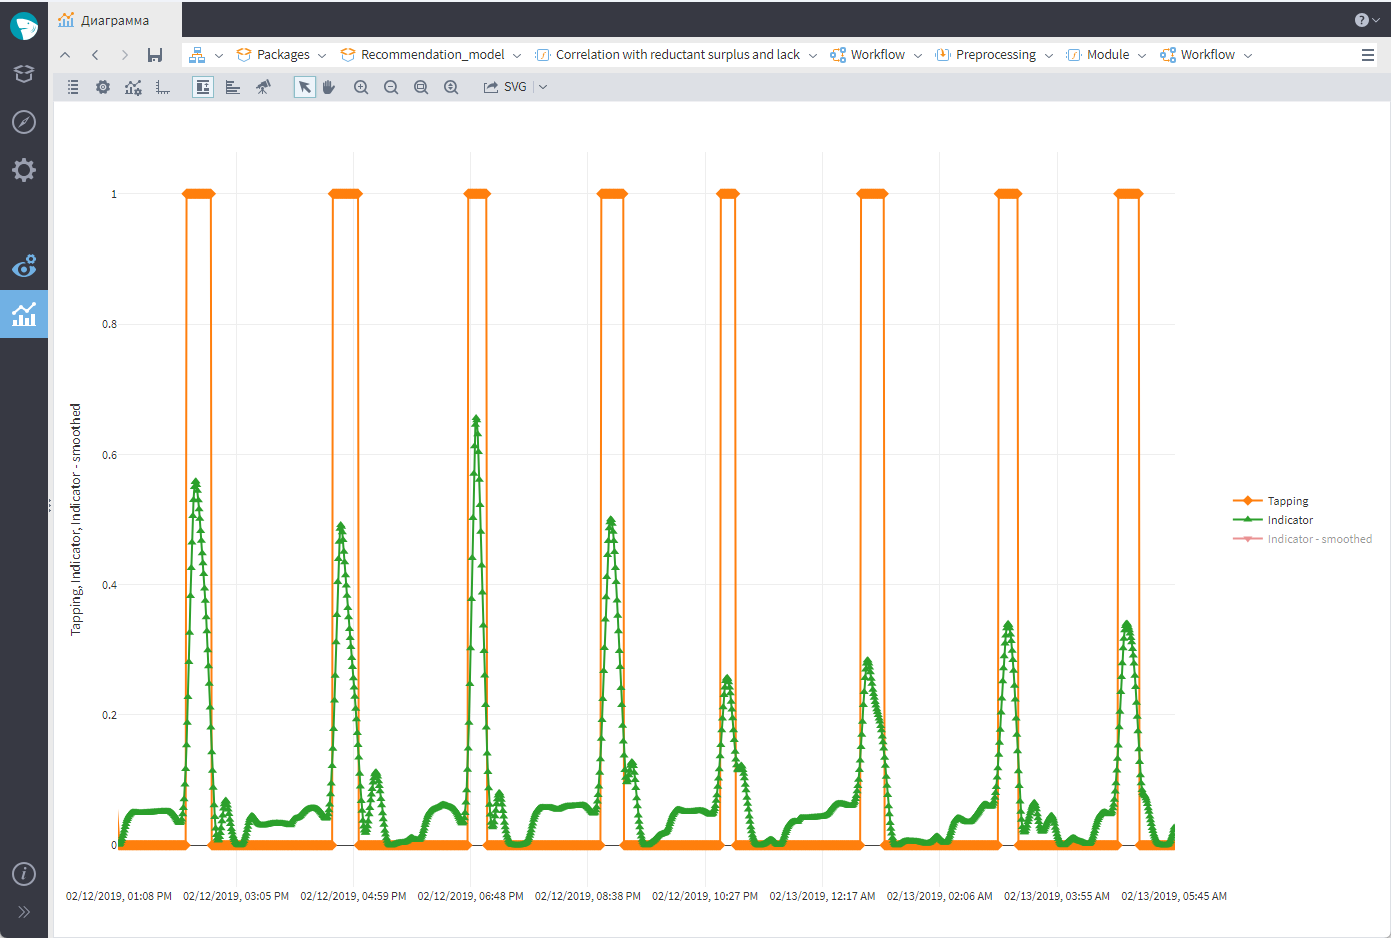
Technology disruption "Lack of reducing agent"
Corrective action: adding coke to the mixture. This event was indicated by changes in the electrical parameters of sensors and the operation of electrodes, with a time lag of about 27 hours.
Technology disruption "Surplus of reducing agent"
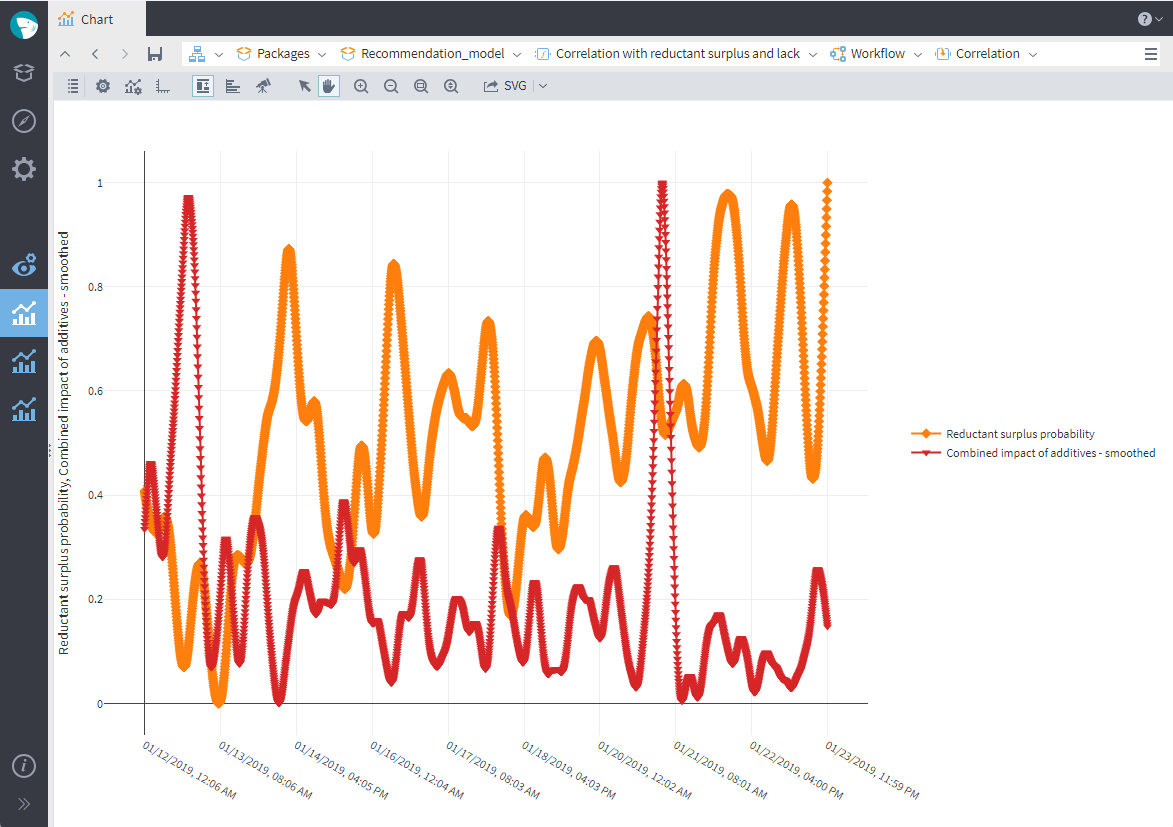
Chrome concentrate was added to the charge mix to balance the influence of coke on the smelting process. This event was indicated by changes in the electrical parameters of sensors and the operation of electrodes, with a time lag of about 28 hours.
Building models
The qualitative characteristics of the above technological disruptions were described with mathematical models based on the data collected over three months.
At the first stage, we determined a time lag of 26–28 hours between altering the charge mix and the change in the electric parameters of the furnace's electrodes. As there is a delay in the furnace operation, the smelting time at each specific moment can only be controlled by means of the electric transformer tap changer.
To discover the type of relation and determine the level of influence of the charge composition on smelting time, we built two models:
- A multilinear regression model
- A neural network
The control parameters used as the model input:
- Data on the charge composition and electrode current
- Data on the furnace operation control modes
Smelting time was chosen as the output parameter.
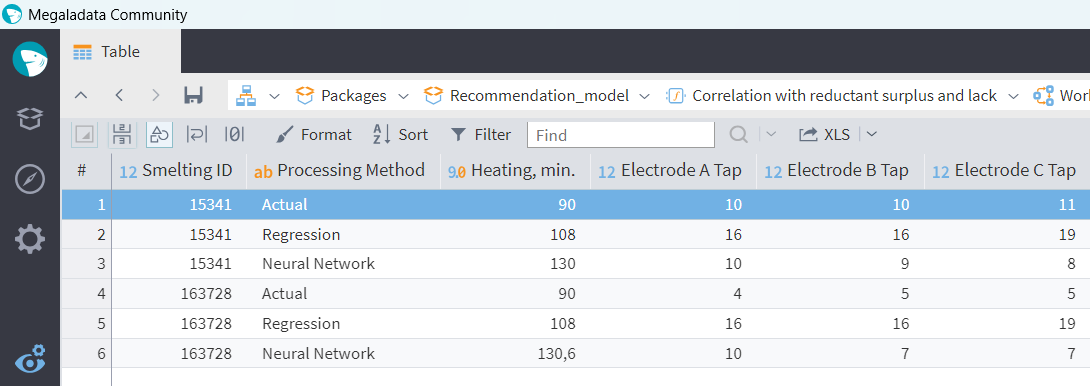
When trying out the models with test data, the neural network proved to be more accurate. Thus, we used the network to generate a table of recommended tap changer characteristics that would ensure an optimum smelting process.
| Parameter | Recommended Value |
| Smelting_ID | 170450 |
| Tap-to-tap period (min) | 130 |
| Tapping duration (min) | 25 |
| Tapping power use (MWh) | 14.87 |
| Heat power use (MWh) | 116.90 |
| Chrome concentrate (id) | 0 |
| Coke nut 10–25 (id) | 270.56 |
| Medium-temp coke (id) | 202.92 |
| Electrode current, phase A (A) | 100.48 |
| Electrode current, phase B (A) | 114.66 |
| Electrode current, phase C (A) | 115.01 |
| Electrode A tap changer (tap number) | 4 |
| Electrode B tap changer (tap number) | 5 |
| Electrode C tap changer (tap number) | 4 |
Table 2. Main control parameters (fragment)
Results
This pilot project proved Megaladata capable of processing large data volumes and building a quality model. Megaladata's machine learning algorithms demonstrated high accuracy in mining raw data for useful information and allowed analysts to provide recommendations on managing the smelting process.
The developed models computed the probability of two technology disruptions in the furnace operation process. These results were confirmed by the mill's experts. The neural network model allowed the analysts to calculate a combination of recommended control parameters.
See also

Megaladata at e-Logi Fest 2026

How Low-Code is evolving ETL
In 2026, you cannot scroll LinkedIn for five minutes without finding a post declaring "ETL is dead, ELT and AI have replaced it." It sounds compelling. It is also wrong.

Megaladata at Plug and Play Armenia Batch 3 Expo
On July 9, 2026, Megaladata took part in the Plug and Play Armenia Batch 3 Expo, the graduation event closing out the three-month International Pre-Acceleration Program in Armenia.
About Megaladata
Megaladata is a low code platform for advanced analytics
A solution for a wide range of business problems that require processing large volumes of data, implementing complex logic, and applying machine learning methods.
GET STARTED!
It's free