Automate requests to large language models using Megaladata. This article explores how to connect to ChatGPT via an API connector on the Megaladata platform. With this connector, you can automate text...
Smart Sales Analysis for Wiser Business Management


The combined use of ABC and XYZ analysis will help you to better navigate the product range, optimize logistics and warehouse stocks, segment customers and partners, and properly set up interactions.
Conducting ABC XYZ analysis is strategically important for any business. This analytical method allows you to get information about sales and answer the following questions:
- Which products should be kept in stock
- How to adjust inventory
- Which clients should be paid more attention
- Which partners are profitable for your business, and which ones aren't.
ABC analysis
ABC analysis allows you to classify company resources according to their importance. It is based on the Pareto principle: 20% of the efforts provide 80% of the result.
Consequently, the following gradation of the categories is obtained by the degree of influence on the overall result:
- A - the most valuable categories. They make up 20% of the entire range, which brings in 80% of the profits.
- B - categories of intermediate importance. They make up 30% of the positions, which account for 15% of the profitability.
- C - the least valuable categories. They make up the remaining 50% and bring only 5% of the total income.
Important: new products should be excluded from the list, as they have not yet proved themselves and still have the potential to be discarded, even though they might have potential.
XYZ analysis
XYZ approach is used to determine the nature of demand. You can determine how stable sales or services are and conduct the analysis of customer behavior at different times.
Grouping is as follows:
- X - stable demand and is accurately predicted. The coefficient varies from 0 to 10%.
- Y - irregular orders, may be difficult to accurately predict. May depend on the season. The coefficient varies from 10% to 25%.
- Z - irregular consumption, single orders, difficult to accurately predict. The coefficient of variation ranges from 25%.
Important: seasonality, marketing events, trends, and other short-term tendencies should be taken into account as well.
ABC XYZ analysis
ABC XYZ sales analysis is a separate independent analytical method. The greatest benefit of using both methods together is the fact that their results overlap. A synergistic effect is created. A broader picture is obtained by comparing the results of both analytical methods than by simply looking at one. ABC analysis helps to identify products that bring the greatest profit, and XYZ analysis gives information about their stability. Why you should not use Excel for ABC XYZ analysis?
It is often advertised that ABC XYZ analysis can be accomplished in Excel. Indeed, the functionality of the spreadsheet application allows you to perform these types of calculations. However, using Excel in a real business situation with a large inventory, many points of sale, and a developed affiliate network, is complicated.
Using Excel will immediately create problems:
- Imagine you need to do an ABC XYZ analysis for at least 50,000 items. Are you sure that you would like to do it manually?
- Opening large files can take a lot of time. How long is it going to take to get around to the actual computation?
- Excel sets the limit to 1,048,576 rows. If there is more data to process, it won't matter how fast Excel is.
- The problem of opening large files is fairly common with Excel. This lag is associated with the use of computational functions, conditional formatting, large data arrays, and pivot tables, etc.
- Reusing and formating is difficult due to the "brakes" and large amounts of data. You have to wait after each step.
The points listed above are enough to come to the following conclusion: you need to use a more advanced tool for real-world calculations.
ABC XYZ analysis in Megaladata
Let's consider a real-world business problem such as an organization that supplies goods for medical institutions.
Purpose of the analysis: categorize products for inventory management.
We conduct ABC XYZ analysis using Megaladata to achieve this goal.
Firstly, upload the file with the data of the goods to use for the entire work session. This file consists of more than 1 million records.
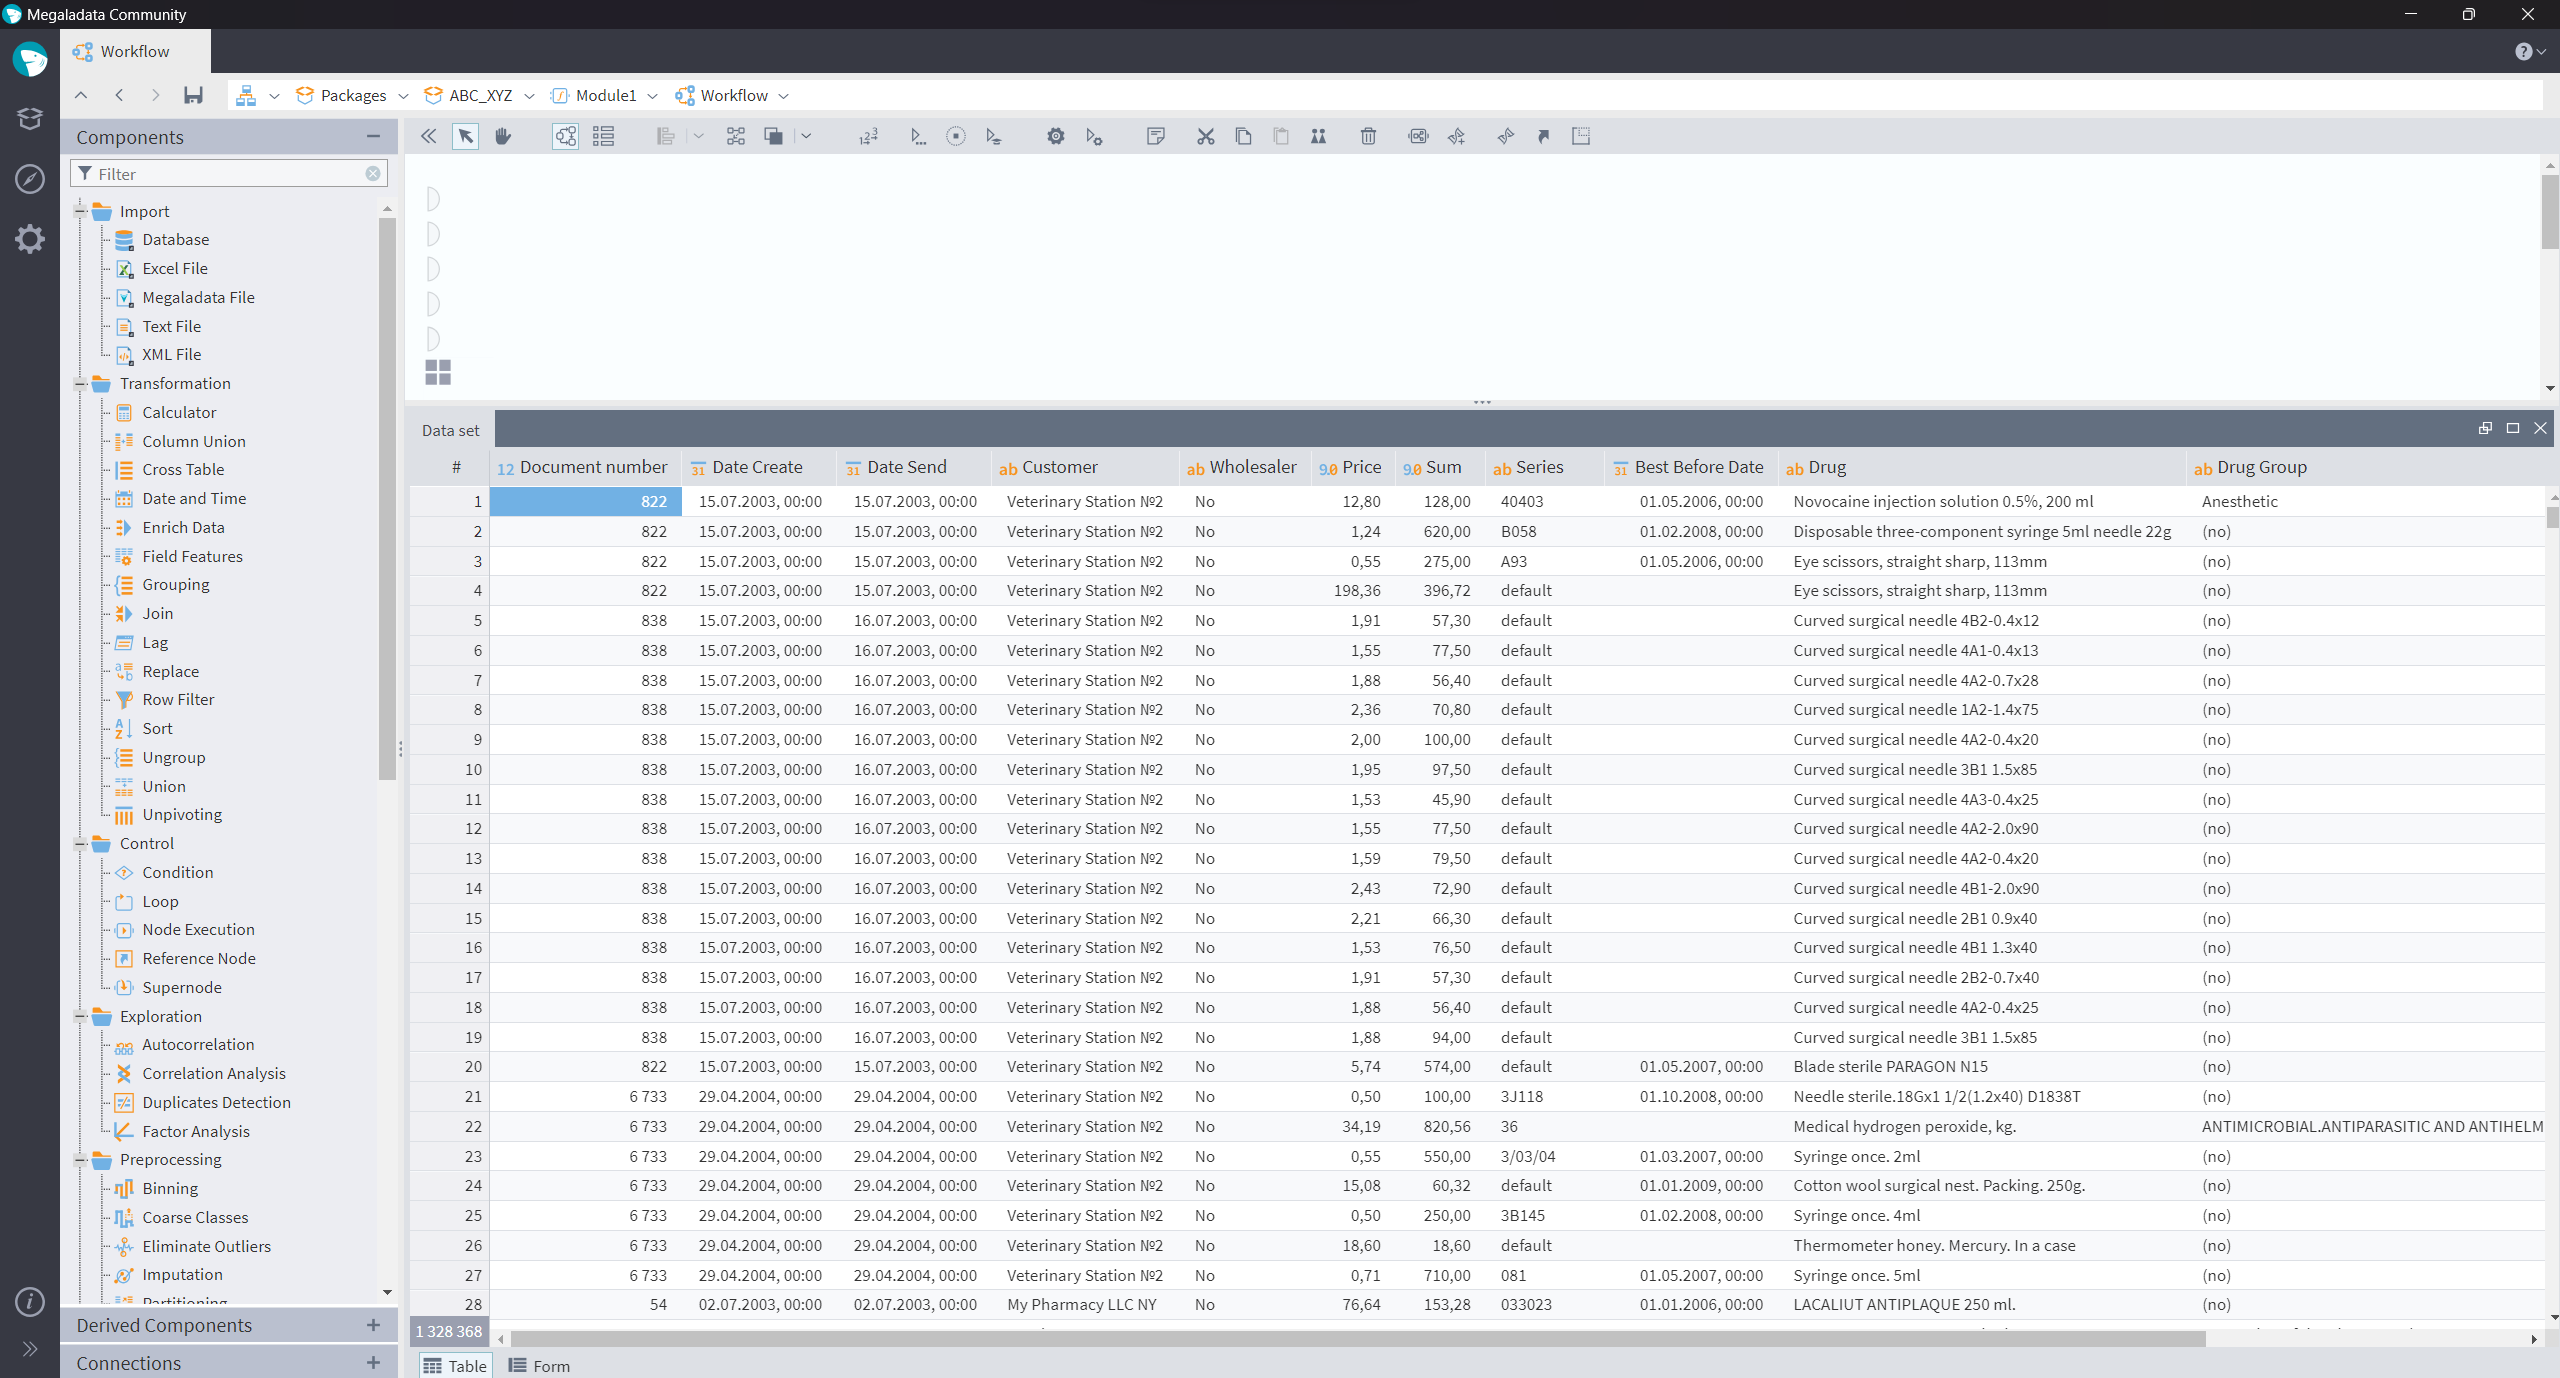
Figure 1: Goods data
The boot process takes just 1 second.
We will create our own script for each type of analysis.
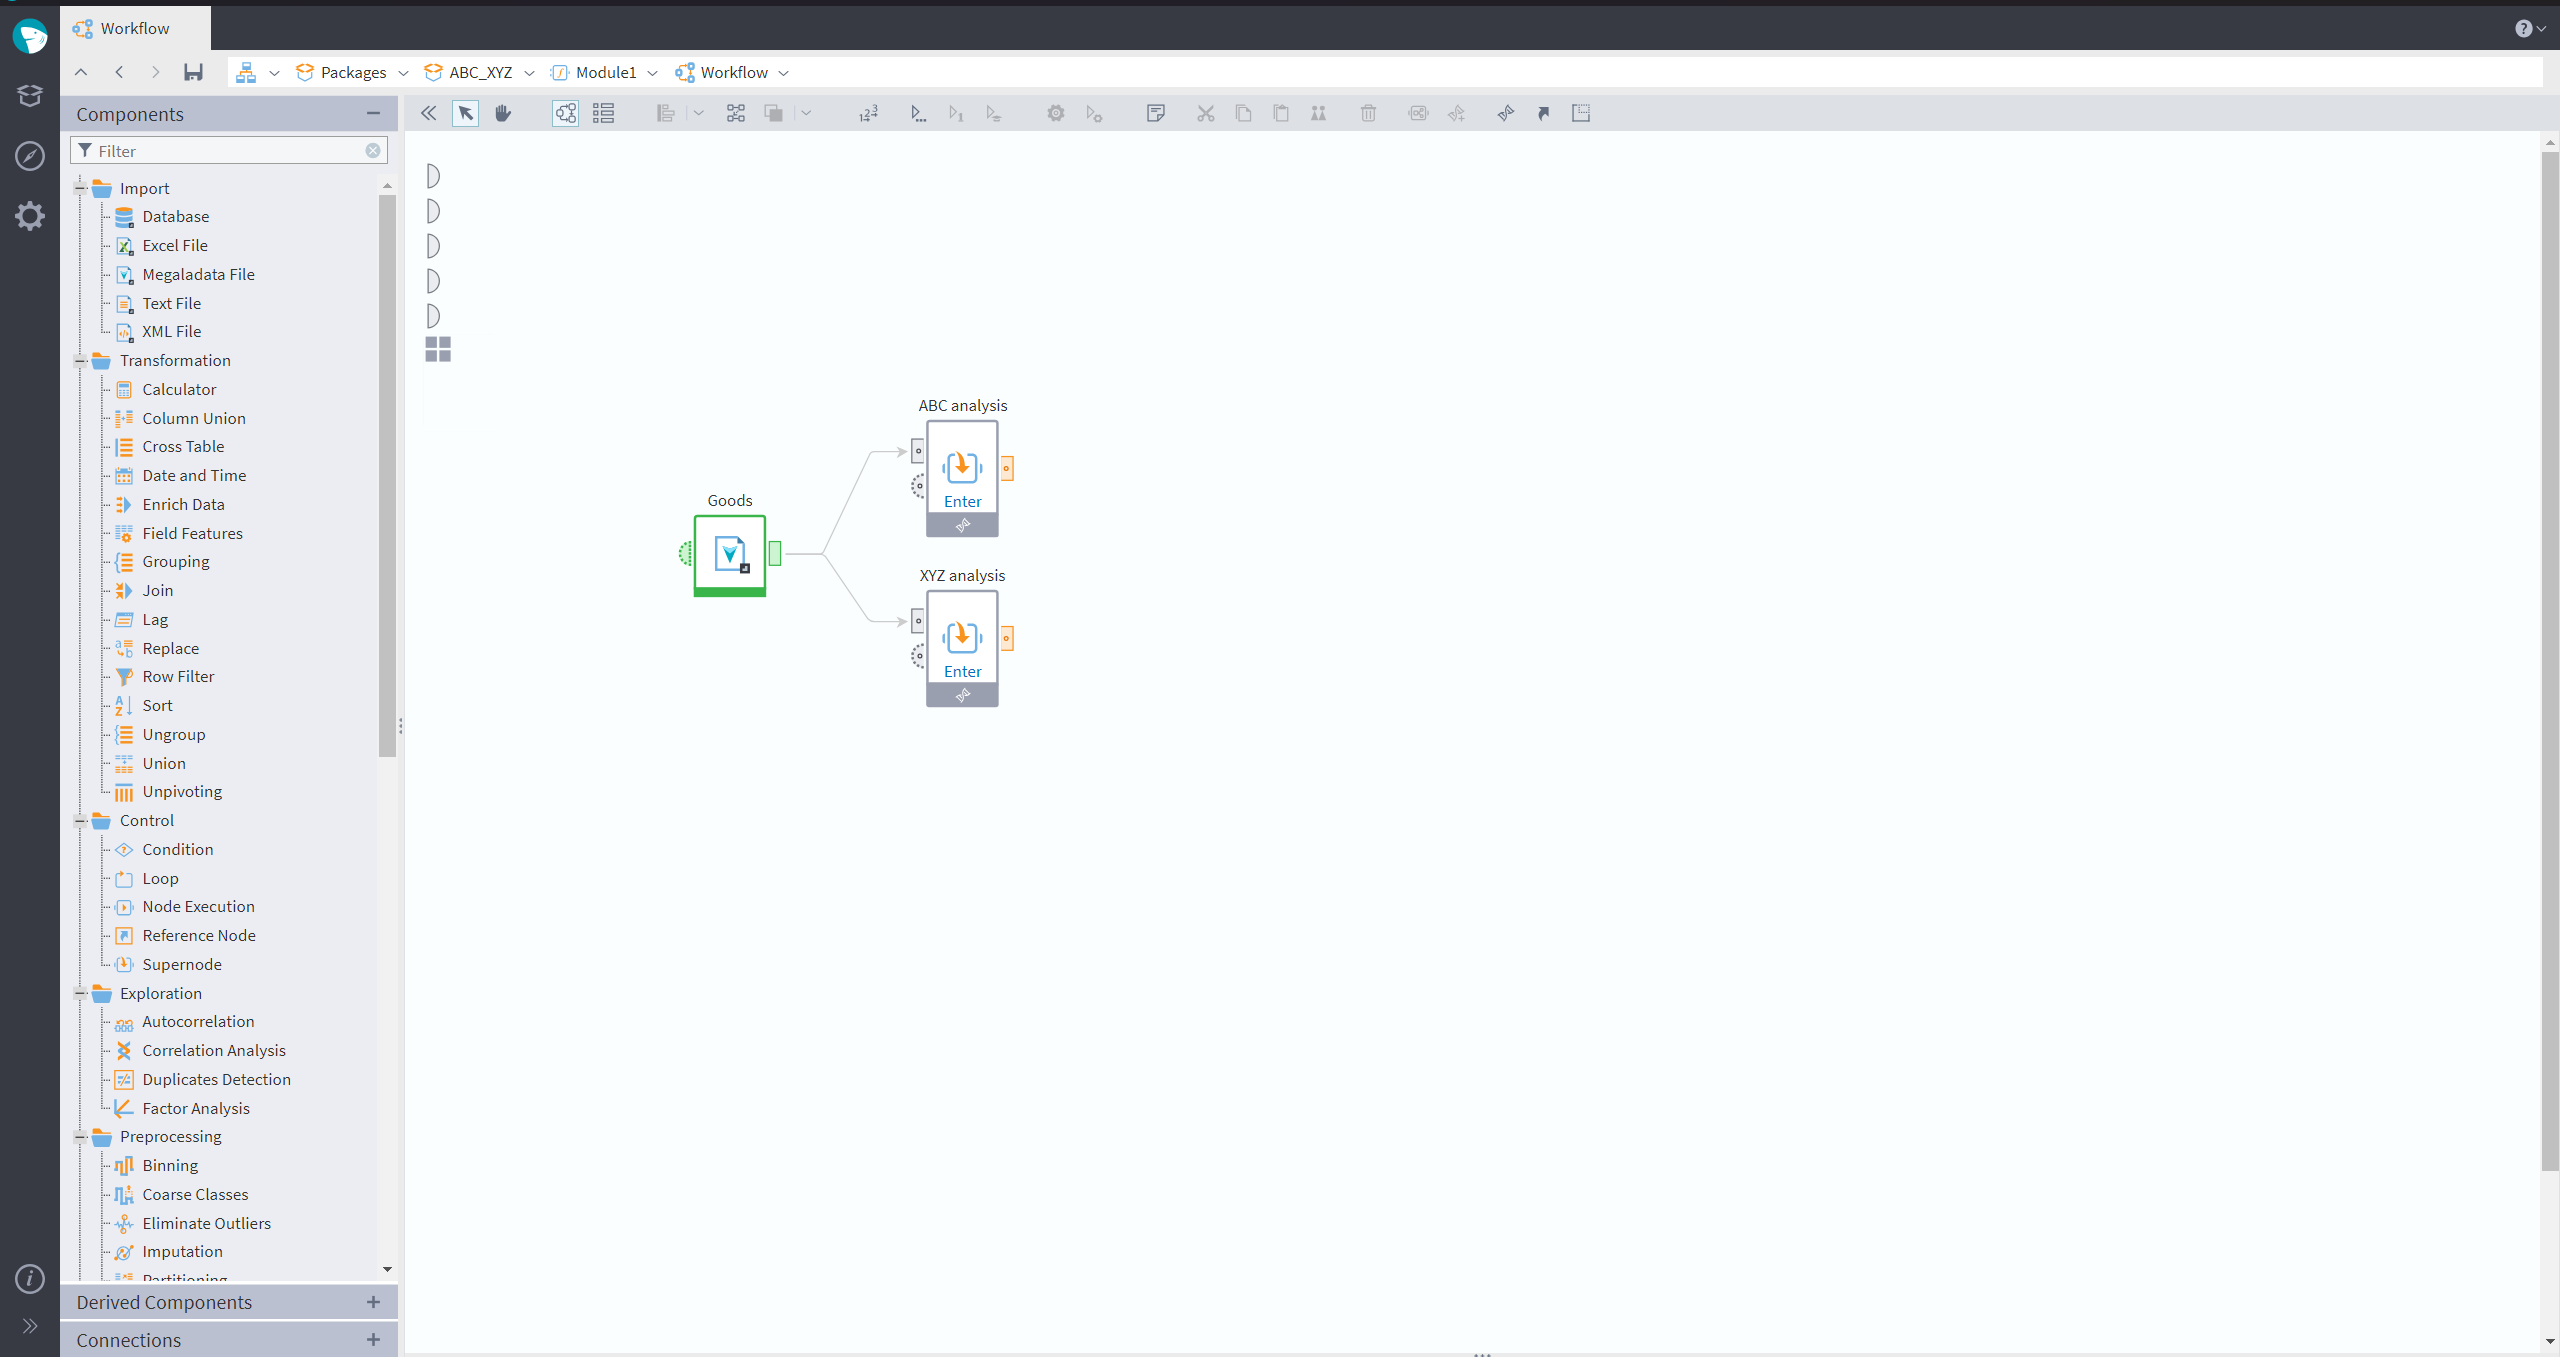
Figure 2: Megaladata workflow
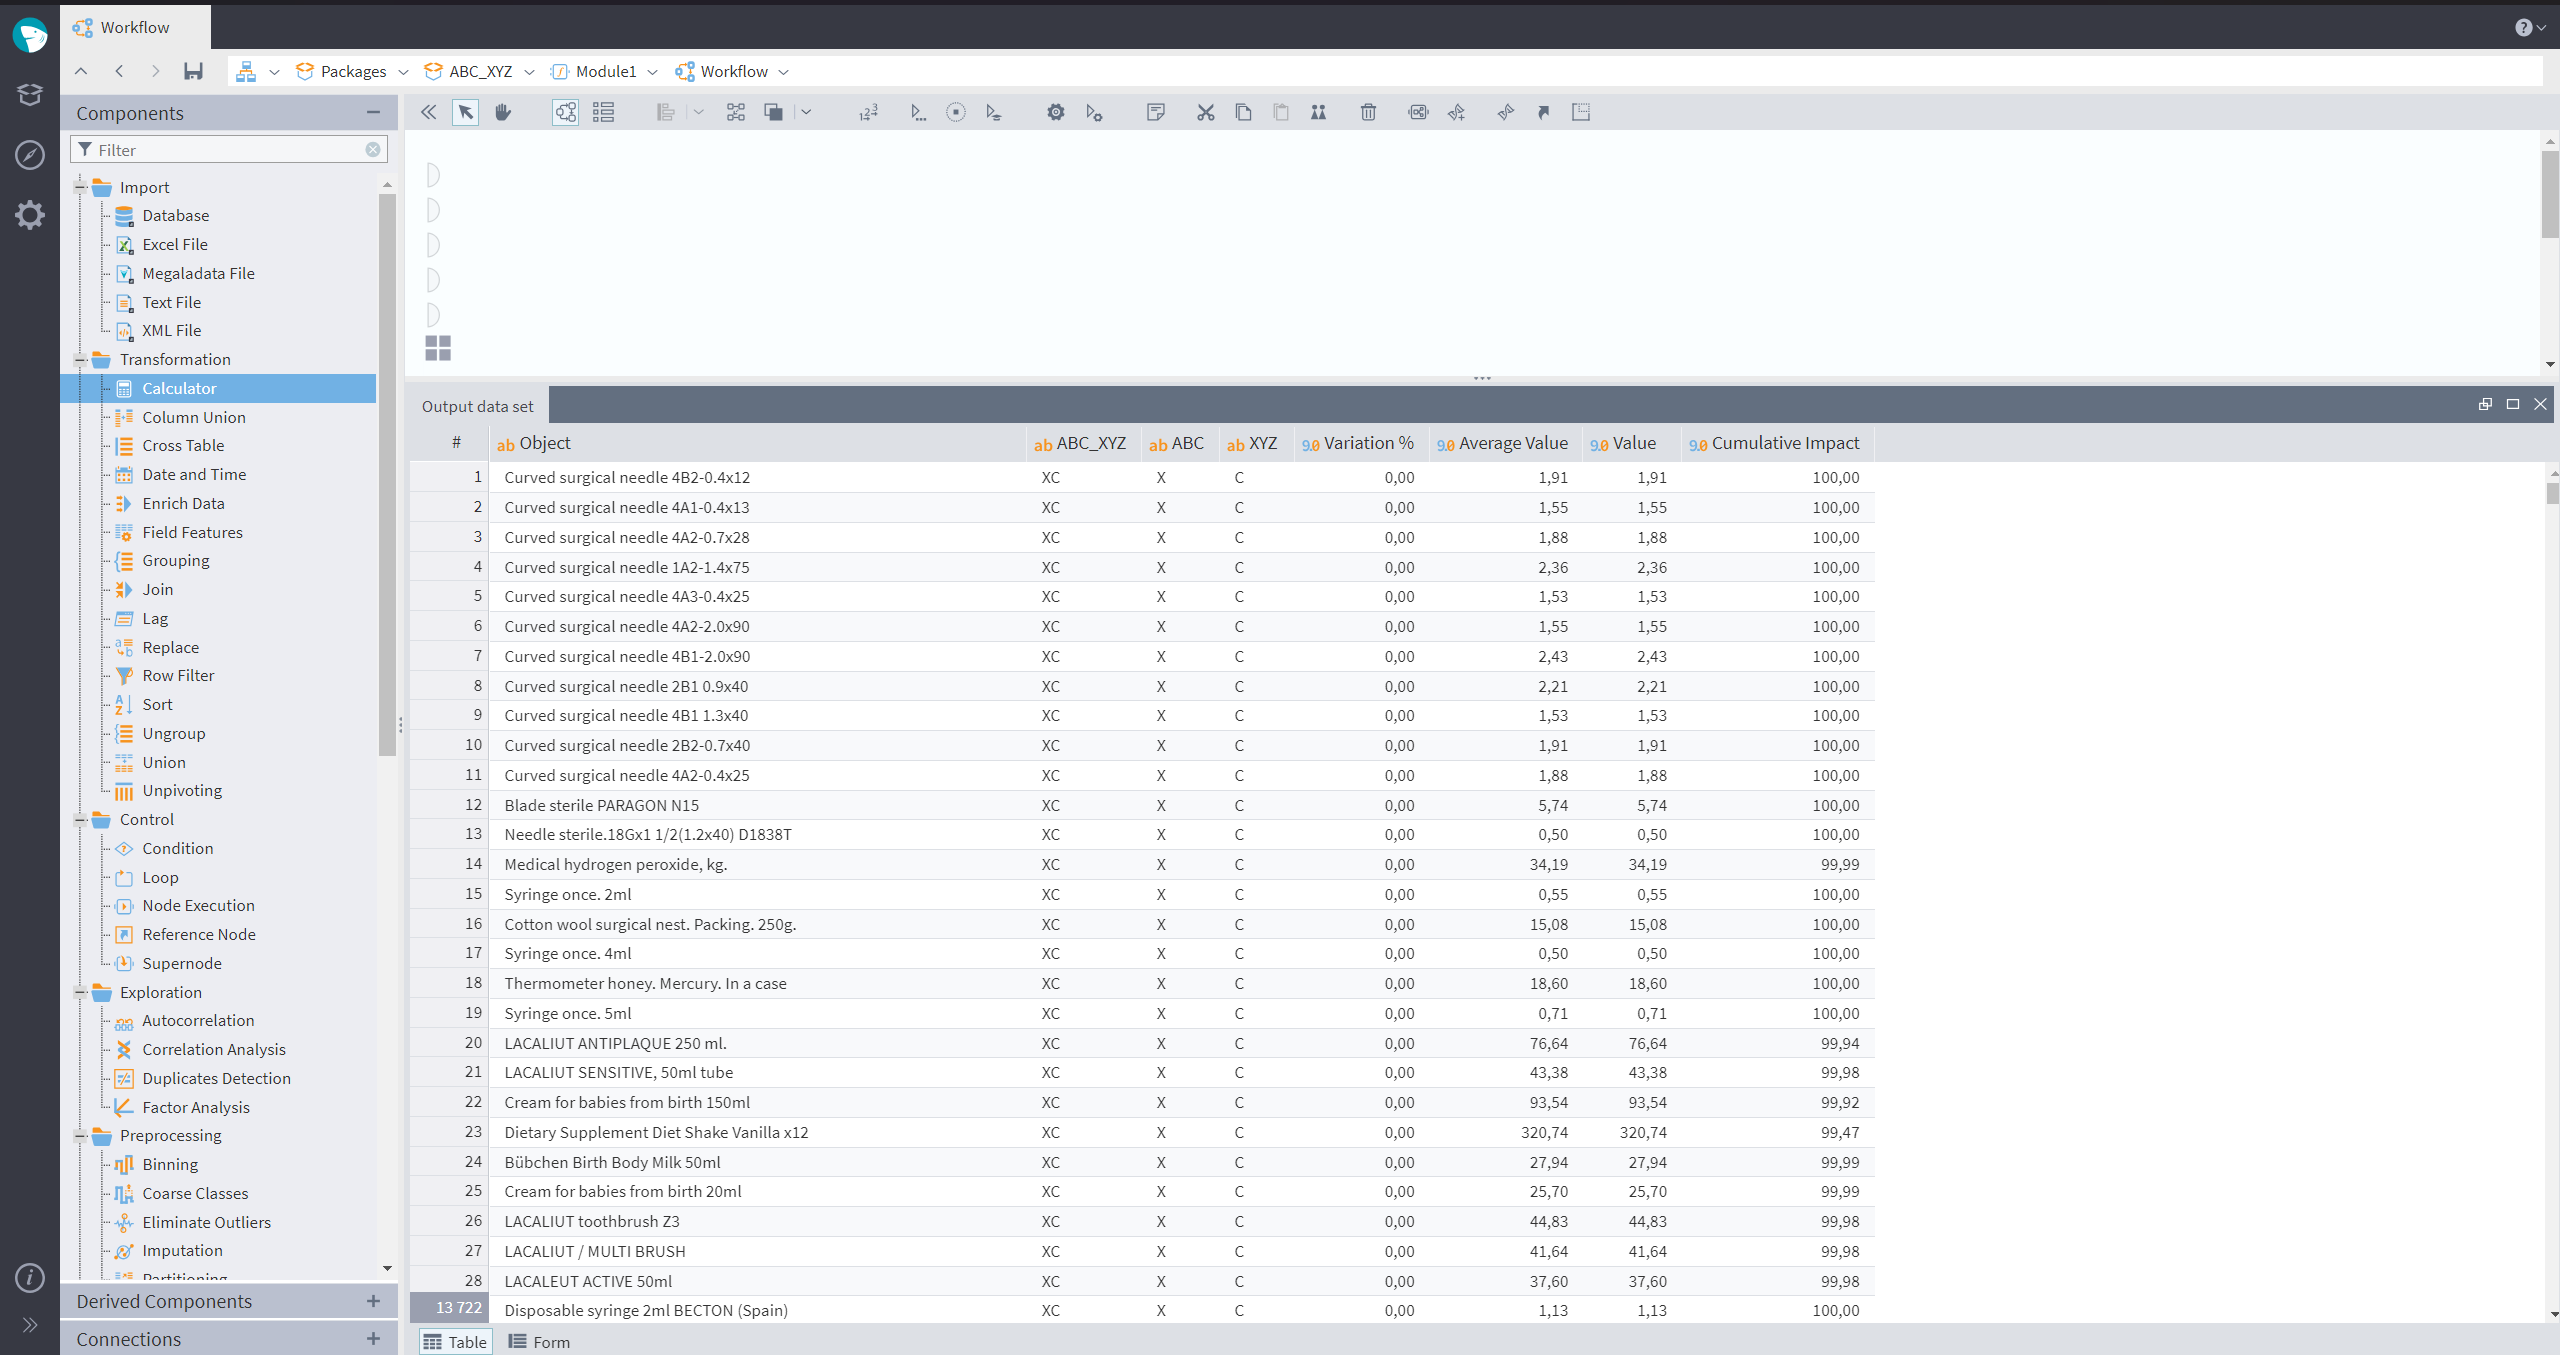
Figure 3: Calculation results
Table: Interpretation of the combined results
| AX | AY | AZ |
|---|---|---|
| Top category. It includes goods with stable high profits and estimated demand. | Good profit is also included here, but sales are not as predictable. | Good income, but the chart has significant deviations. In other words: "some today, nothing tomorrow." |
| BX | BY | BZ |
| Average but stable income. Easy to anticipate future changes. | Unstable consumption with an average margin rate. | Unpredictable demand in conjunction with an average revenue. |
| CX | CY | CZ |
| Low cost with a stable forecast. "Small but precious". | Low price and irregular demand. | This category brings neither earnings nor constancy. You should remove such items in 99% of cases. |
Visualization of ABC XYZ analysis results
Megaladata allows you to visualize data in the most convenient way by building an OLAP cube for a visual representation of the results.
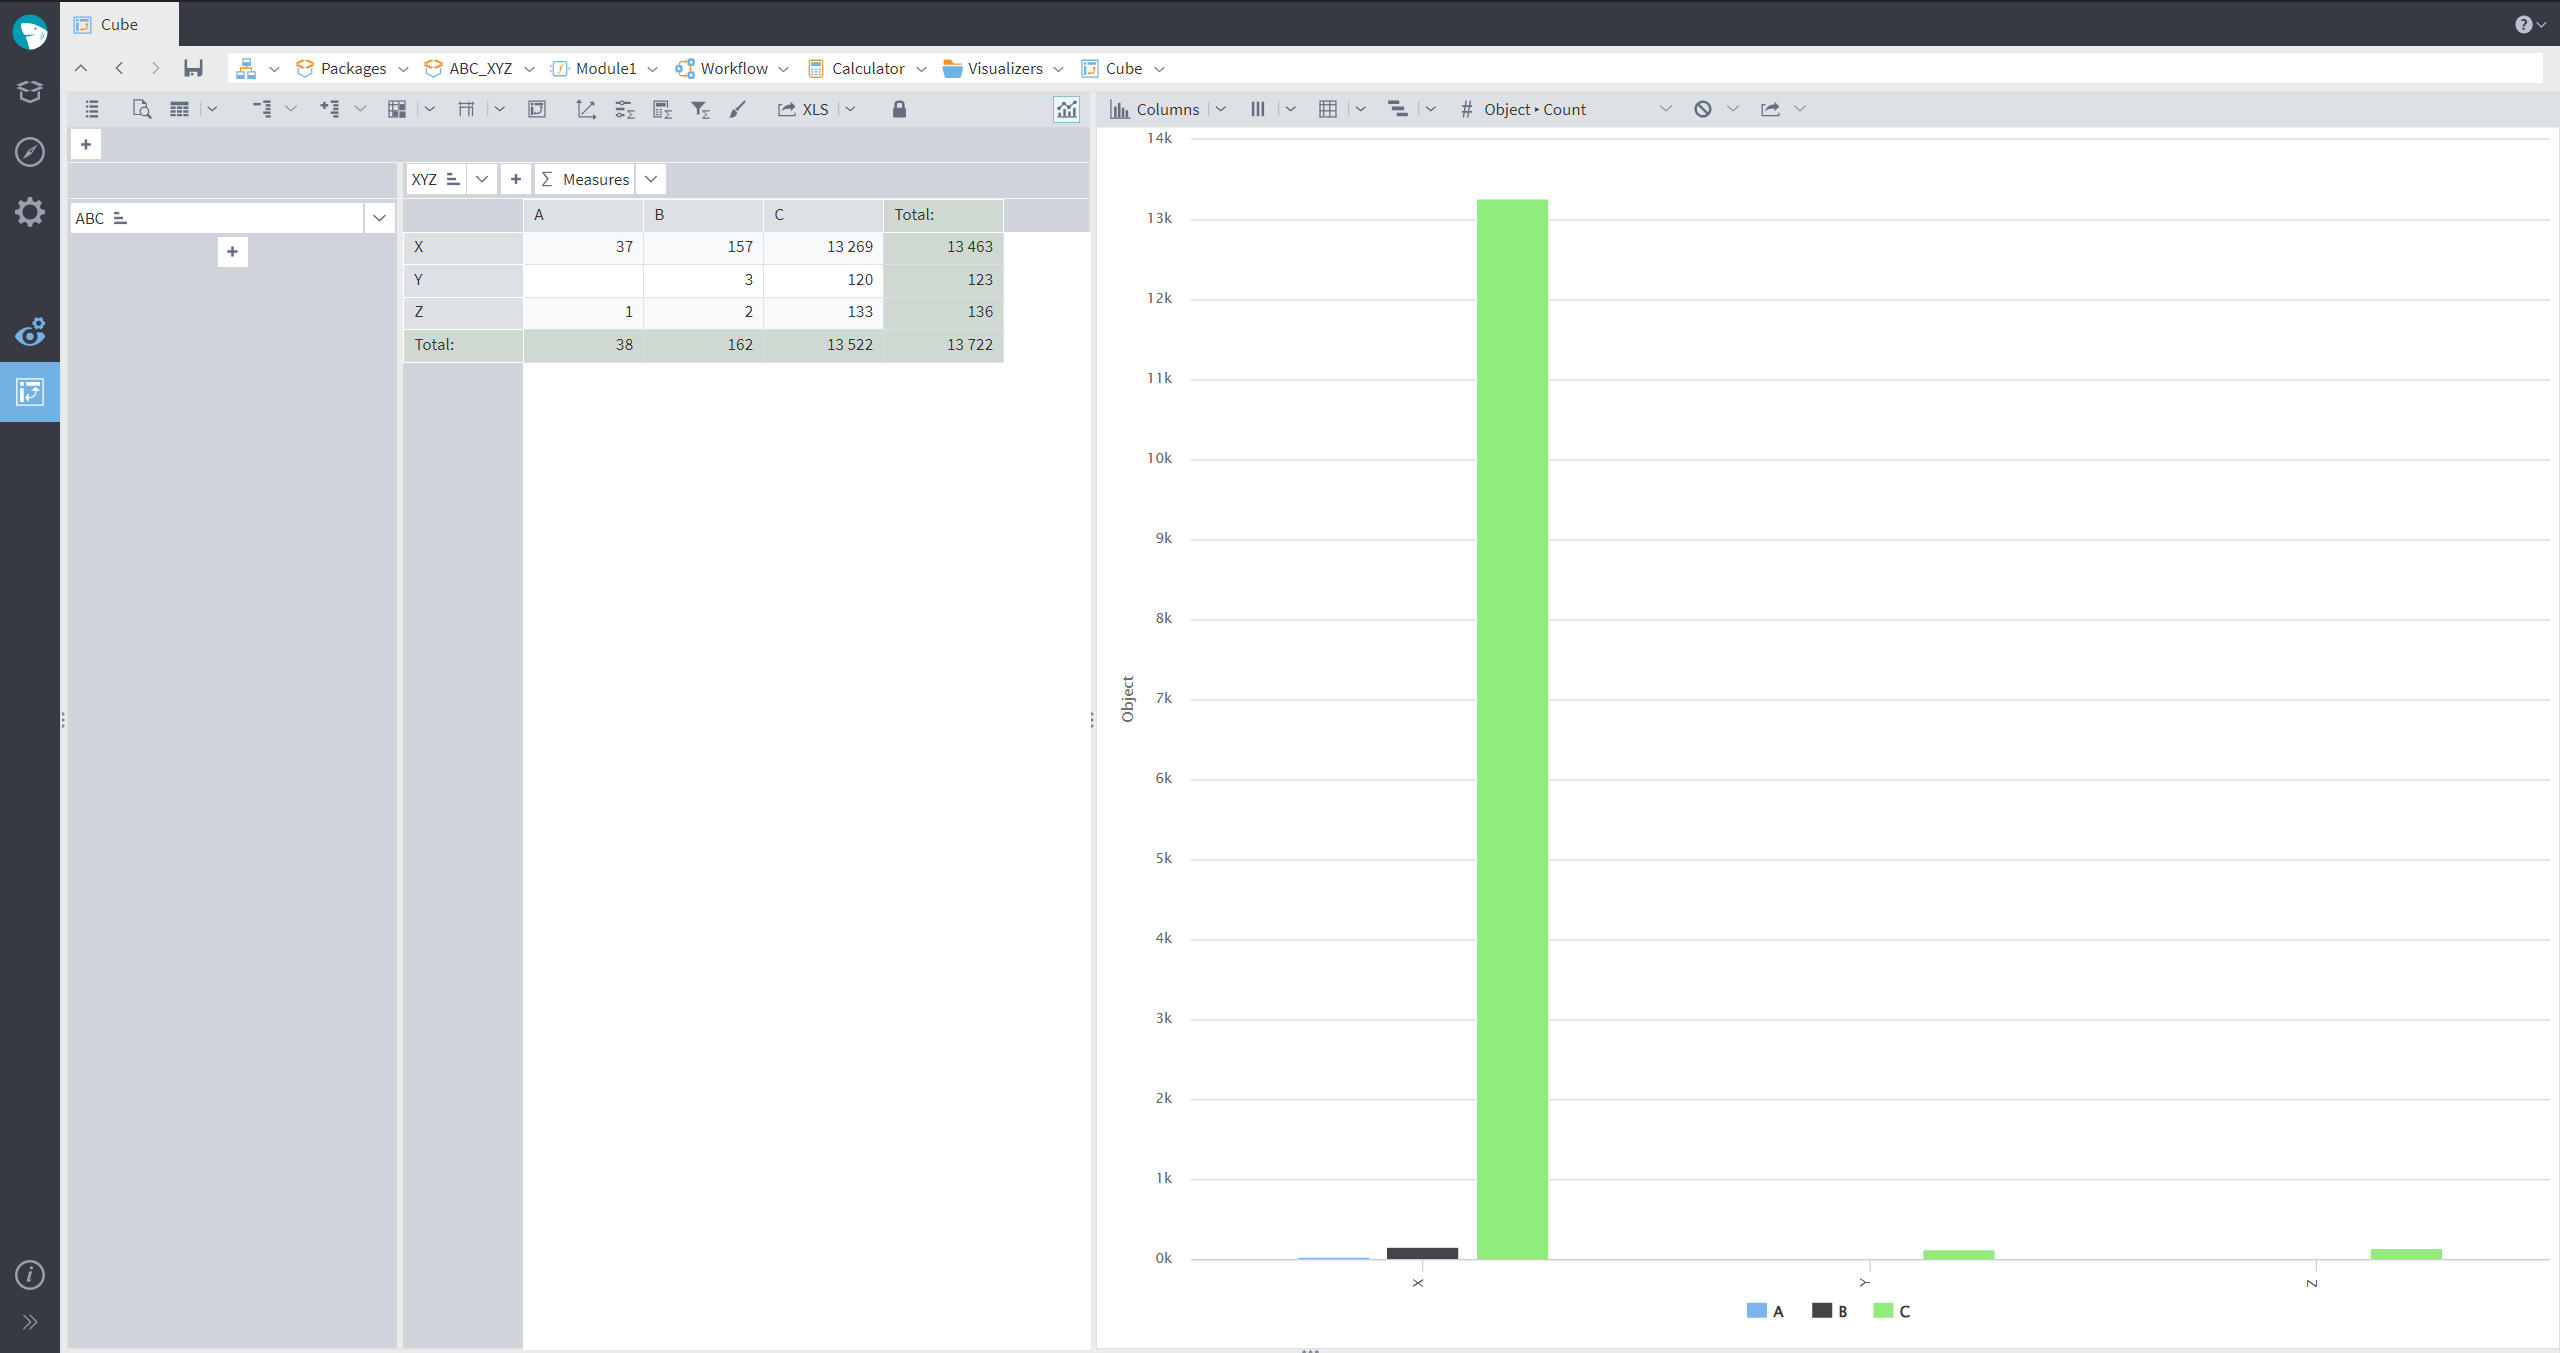
Figure 4: Visualisation of ABC XYZ analysis results
As you can see from our example, there are only one AX products in the company. There are no goods like AY, which also bring a high stable income. The bulk consists of small irregular sales.
Poorly selected limits can lead to the fact that almost all the products fall into one category. This makes the use of ABC XYZ analysis meaningless, as its goal is to build up the work with each of the groups in different ways. In the case when empty cells appear in the final table or the data is distributed unevenly, the boundaries of ABC and XYZ should be reviewed.
Empirically, we change the limits of the ABC analysis as follows:
- A is the lowest limit of 90%.
- B is the lowest limit of 95%.
- C - all the limits remaining.
When there are no more empty cells, the result is as follows:
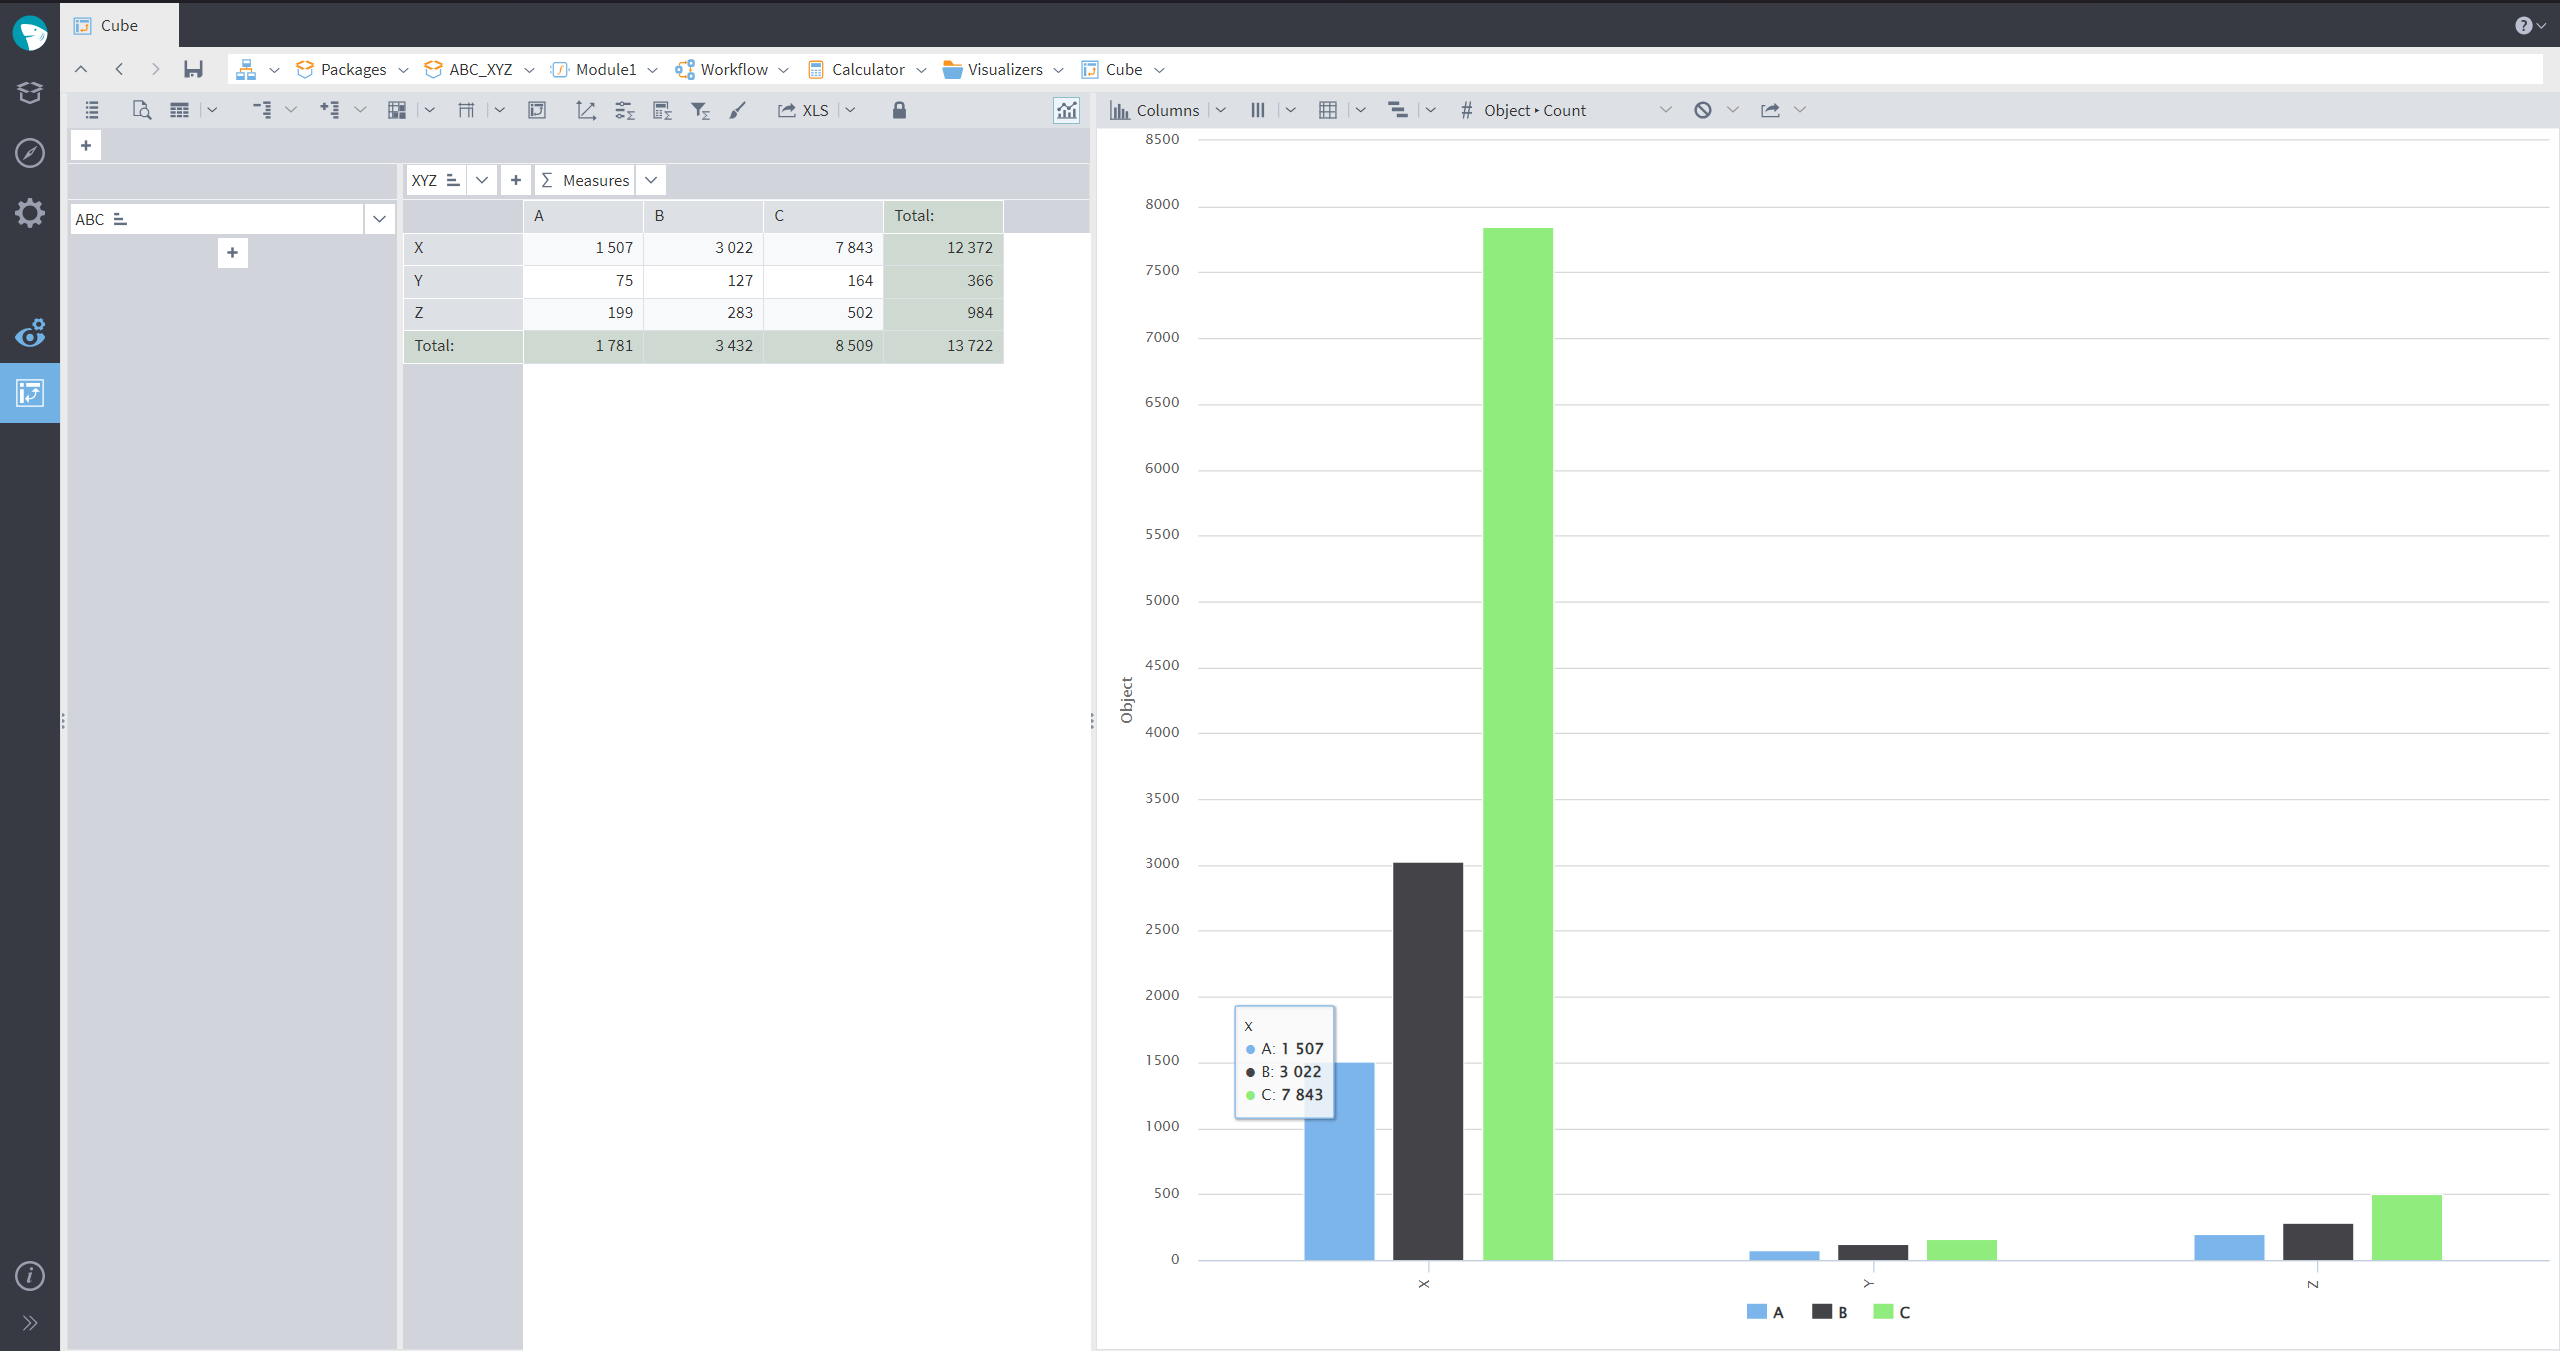
Figure 5: ABC XYZ result
It is not necessary to follow the Pareto principle in order to conduct the ABC analysis. Borders can be changed until the data in the final table is optimal for further work.
ABC XYZ analysis reports provide important information. It is much more efficient to concentrate on the products which bring the biggest profit in the context of a long period of time.
In addition, you should observe the deviation of the report in dynamics. Products can change categories from one to another over time. The fact that the product is now in the AX category does not mean that it will be there in the next quarter. ABC XYZ analysis would reveal the product which has been the most profitable and when it has stopped making a profit. It will allow you to manage inventory and quickly take measures in order to restore demand.
Megaladata is a business solution
Megaladata is a reliable and fast tool for working with large data arrays:
- It allows you to load large volumes of data quickly, without "brakes".
- It performs complex calculations on the fly.
- The scripting principle of work without reference to specific data allows you to create supernodes and use them in other scripts.
- Visualization of reports allows you to monitor any changes and flows of data over time in different sections.
See also

Connecting to ChatGPT on the Megaladata Platform

Megaladata at FINTECH360: Bringing analytics to Fintech
From April 27 to 29, Megaladata sponsored the FINTECH360 International Conference in Yerevan, joining over 500 senior executives from banks, payment platforms, fintech startups, and IT firms across more...

AI Case Studies with Megaladata
This report examines how Megaladata uses artificial intelligence to solve diverse problems. It details the specifics of working with large language models (LLMs) in Megaladata, including: Structuring and...
About Megaladata
Megaladata is a low code platform for advanced analytics
A solution for a wide range of business problems that require processing large volumes of data, implementing complex logic, and applying machine learning methods.
GET STARTED!
It's free