This new Megaladata release expands the platform's integration and UI capabilities and enhances information security. Megaladata Integrator now includes an MCP server. New authentication and autorization...
Working with Tree Structures in Megaladata


A tree model is one of the common structures for storing and transferring data. Universal exchange formats, such as JSON and XML, use exact hierarchical representations of information. However, most algorithms are designed to store data as flat tables. Megaladata has special components for working with tree structures.
Flat tables and trees are the most popular structures for storing and transferring data. In flat tables, information is represented in a simple structure. Each row represents a single object or event, and each column holds an attribute that describes that specific record. Trees offer a more complex approach, storing data in a hierarchical structure with arbitrary depth nesting. This allows trees to represent relationships between data points, something flat tables cannot do.
There are several widely used formats for representing data in a hierarchical structure, including JSON and XML. These formats store information using name-value pairs, ordered lists, and other objects, and can include nested structures to represent hierarchical relationships. They are compatible with various operation systems or databases.
Trees excel at representing complex data with nested relationships. They allow for rich descriptions of objects with many attributes. However, many data analysis algorithms are designed to work best with simpler, flat table structures. This can make it more challenging to directly analyze tree data using these algorithms.
Example of JSON File Structure
JSON files are used to exchange data between applications, including databases and analytics platforms. For example, credit bureaus provide banks with access to borrowers' credit history through a JSON-based API.
A credit history is a complex dataset encompassing a wide range of information, including personal details, employment history, loan records, payment history, and more. This is how it may look in the JSON format:
{
  "applicant": {
    "name": "Job Pou",
    "birthdate": "1980-05-15",
    "address": "123 Main St, City, State",
    "employment": "ТТТ",
    "annual_income": 600000
  },
  "credit_scores": {
    "equifax": 750,
    "transunion": 720,
    "experian": 730
  },
  "credit_history": [
    {
      "account_type": "Credit Card",
      "account_number": "123456789",
      "current_balance": 50000,
      "credit_limit": 100000,
      "payment_status": "Current"
    },
    {
      "account_type": "Auto Loan",
      "account_number": "987654321",
      "current_balance": 15000,
      "original_balance": 20000,
      "payment_status": "Late"
    }
  ]
}
This example contains the following information:
- Applicant: The applicant's name, date of birth, address, place of employment, and annual income.
- Credit_scores: The applicant's credit scores from different bureaus.
- Credit_history: The applicant's credit account data such as account type, account number, current balance, credit limit, and payment status.
Even though this example is small, it contains a credit history array — Credit Card and Auto Loan. In reality, such a file usually stores much more information and can contain thousands of lines.
A credit application structured as a tree is fed into a decision-making system, called a credit conveyor. This system performs complex checks and determines the final outcome. As the application is processed, the tree structure can be enriched with additional data, such as contract terms, interest rates, and loan amounts. Traditional flat tables used by analytical algorithms cannot represent these complex tree structures effectively.
Megaladata offers mechanisms to process tree structures, allowing conversion between them and tables.
Trees in Megaladata
A tree structure is a hierarchical data organization. Each piece of data, called a tree node, connects to a single parent node, except for the topmost one, which is the root. A tree allows for multiple child nodes branching from each parent.
The Megaladata platform primarily uses flat tables for simple data. However, for data with inherent hierarchies, the platform offers two special components. These components enable seamless conversion between hierarchical data (trees) and flat tables, facilitating easier processing and analysis.
This way, Megaladata bridges hierarchical data and standard formats. It transforms tree-like structures into a compatible format for its built-in processing tools, enabling easier data analysis. Conversely, Megaladata can convert analysis results back into a hierarchical structure, to exchange the information with external systems.
This article uses a practical example to demonstrate how to convert a table into a tree structure, and vice versa. All the steps can be performed within the Megaladata analytics platform.
When importing an XML file, the data is automatically converted into a tree structure. It requires no coding, since the structure is described in a WSDL (Web Services Description Language) file. However, for this automatic conversion to work, the WSDL file must be present.
JSON, on the other hand, takes a simpler approach. JSON files don't require a separate file to describe their structure. This makes them more concise and easier to work with. However, the downside is that computers can't automatically understand the data's organization. To solve this, a JavaScript component can be used to parse (read and interpret) the JSON file.
The input JSON looks like this:
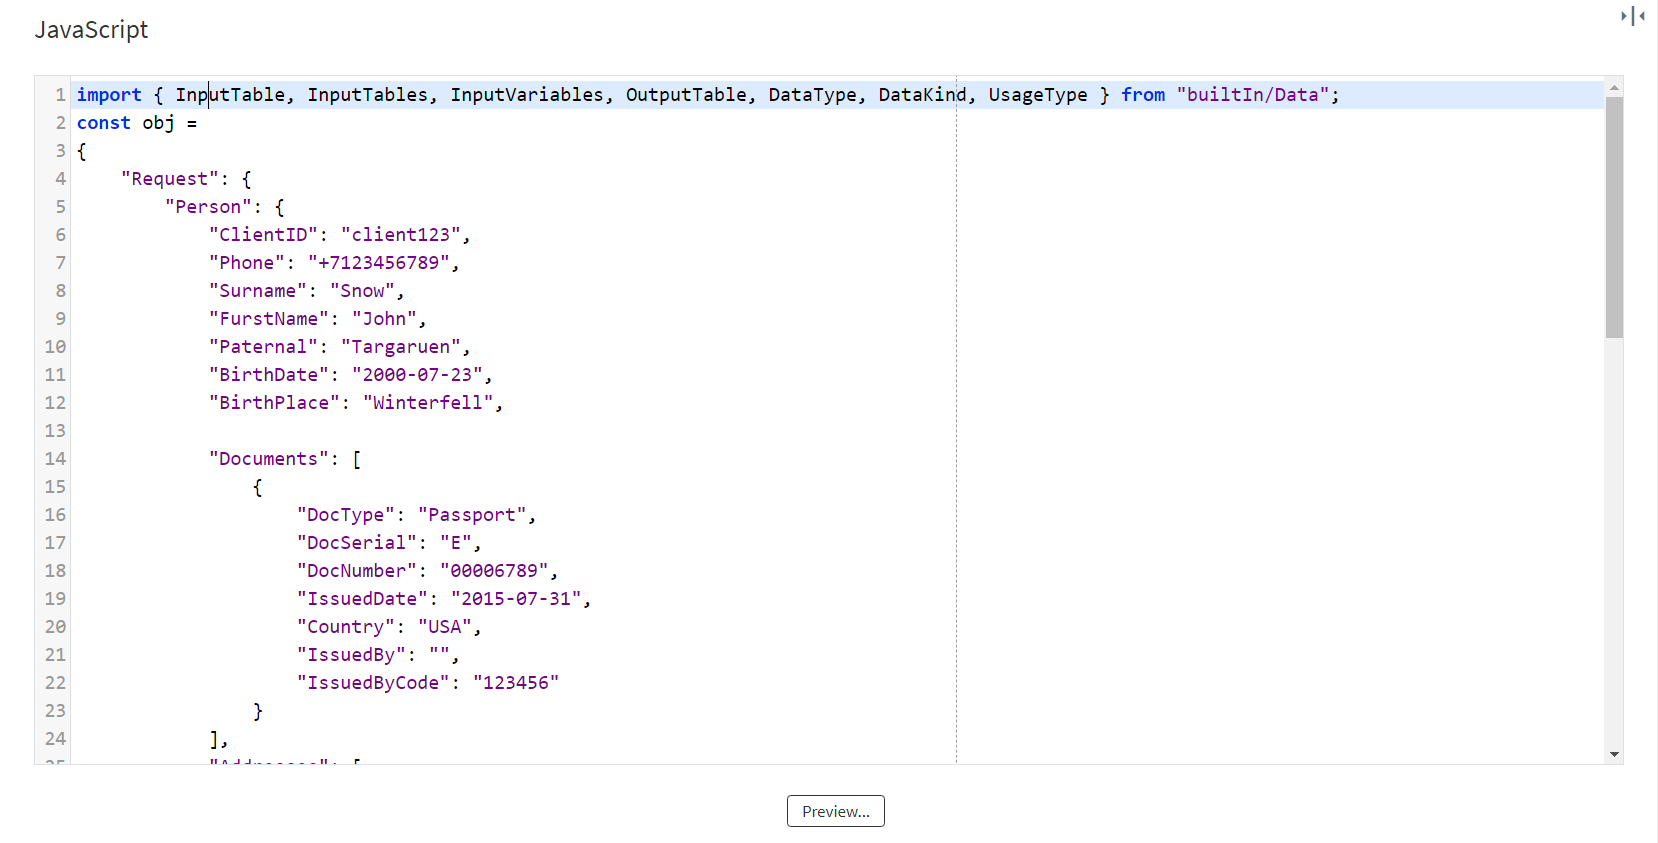
Figure 1: Original JSON
Nested JSON data can be awkward to handle as information is scattered throughout. A JavaScript component can be used to transform it into a more manageable format, i.e., a table. This component allows you to write a short script which would navigate the nested structure, extract each data element and its value, and create a corresponding table row for each element. The table's columns would then represent the different data fields within the JSON.
import { InputTable, InputTables, InputVariables, OutputTable, DataType, DataKind, UsageType } from "builtIn/Data";

const json = JSON.parse(InputTable.Get(0,'RawJSON'))
const fields = JSON.parse(InputVariables.Items.fields.Value)

let fieldsMap = {}
let globalIndexesCounters = {}
OutputTable.ClearColumns;
fields.forEach(field => {
 OutputTable.AddColumn(field)
    fieldsMap[field.DisplayName] = field.Name
    if(field.Name.includes('_global_index')){
     globalIndexesCounters[field.Name] = 0;
    }
})

function AddRow(row){
    OutputTable.Append()
 Object.keys(row).forEach(key=>{
     OutputTable.Set(key, row[key])
    })
}

let rows = []

function getObjType(obj){
    if(!obj || typeof obj !== 'object'){
     return 'key'
    } else {
  if(Array.isArray(obj)){
         return 'array'
        } else {
         return 'object'
       }
    }
}

function objWalk(obj, objKeyName, parentKeyPath, currentRow){
    let objKeyPath = parentKeyPath ? parentKeyPath + '.' + objKeyName : objKeyName

    if(Array.isArray(obj)){
        let rowOfArr = Object.assign({},currentRow);

        if(obj.length > 0){
            const itemType = getObjType(obj[0])
            switch(itemType){
                case 'key':
                                       let fieldIndex = fieldsMap[objKeyPath + '.' + objKeyName + '_global_index']
                    let field = fieldsMap[objKeyPath + '.' + objKeyName]
                    if(fieldIndex && field){
                        obj.forEach((item,idx) => {
                            rowOfArr[fieldIndex] = globalIndexesCounters[fieldIndex]++;
                            rowOfArr[field] = item
                            rows.push(Object.assign({},rowOfArr))
                            rowOfArr = Object.assign({},currentRow)
                        });
                    }
                    break;
                case 'object':
                    obj.forEach((item,idx) => {
                        let fieldIndex = fieldsMap[objKeyPath + '.' + objKeyName + '_global_index']
                        if(fieldIndex){
                            rowOfArr[fieldIndex] = globalIndexesCounters[fieldIndex]++;
                            objWalk(item, objKeyName, parentKeyPath, rowOfArr)
                            rows.push(Object.assign({},rowOfArr))
                            rowOfArr = Object.assign({},currentRow);
                        }
                    });
                    break;

                case 'array':
                    let fieldIndexA = fieldsMap[objKeyPath + '.' + objKeyName + '_global_index']
                    if(fieldIndexA){
                        obj.forEach((item,idx) => {
       rowOfArr[fieldIndexA] = globalIndexesCounters[fieldIndexA]++;
                            objWalk(item, objKeyName+ '_SUBARR', objKeyPath, rowOfArr)
                            rows.push(Object.assign({},rowOfArr))
                            rowOfArr = Object.assign({},currentRow);

                    });
                    }
                    break;
            }
        }
    }
else {
        let keysByType = {
         'key': [],
            'object': [],
            'array': []
        }
        Object.keys(obj).forEach(key => {
         keysByType[getObjType(obj[key])].push(key)
        })

        keysByType.key.forEach(key => {
         let keyPath = objKeyPath ? objKeyPath + '.' + key : key
            let fieldName = fieldsMap[keyPath]
            if(fieldName){
                currentRow[fieldName] = obj[key]
            }
        })

        keysByType.object.forEach(key => {
            objWalk(obj[key], key, objKeyPath, currentRow)
        })

        keysByType.array.forEach(key => {
            objWalk(obj[key], key, objKeyPath, currentRow)
        })
    }
}

let currentRow = {}
if(getObjType(json) == 'array'){
 json.forEach((item,idx) => {
     currentRow = { _global_index: idx}
        objWalk(item, '', null,currentRow)
    })
} else {
 objWalk(json, '', null,currentRow)
}
if(rows.length == 0){
 rows.push(currentRow)
}

rows.forEach(row => {
 AddRow(row)
})
We get the following table:

Figure 2: Displaying data in a table
The table consists of 4 rows and 30 columns. There are duplicates and omissions in it.
Since there are two different address fields, a column with an index is added in the tabular form; the lines "null", actual address, and registration address appear.
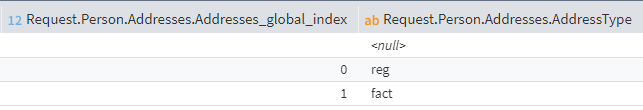
Figure 3: Column with index
- Personal information
- Documents
- Address
Organizing this information into a table eliminates empty values and duplicates, resulting in a cleaner presentation.
There are several solution options, including combined use of components: Grouping, Row Filter, Field Parameters.
This approach causes certain difficulties:
- With a large number of fields, it's hard to find the right ones.
- It is easy to get confused with indicators when grouping.
- Filtering can be used to remove empty values, but a large number of conditions must be specified.
An alternative solution is to use Table to Tree and Tree to Table components.
Let's convert the table into a tree structure using the Table to Tree component.
For linking, there are two options:
- Creating nodes manually: one tree root, from it you add child nodes, from which, in turn, you can add children and neighboring nodes.
- Reading the structure from a ready-made schema (xsd file).
When configuring the nodes manually, we need to start with creating the main node (we name it "Person"). Let's specify that the node is a "Container" — this will allow us to create children nodes.
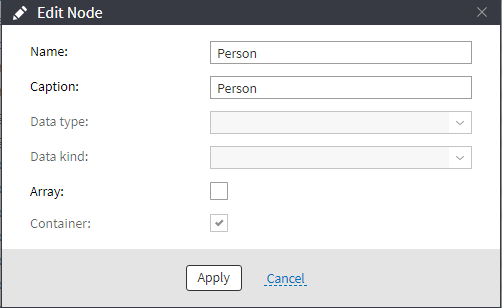
Figure 4: Creating a node
From "Person", we need to create nodes with personal information and add a "Documents" node labeled "Container" to add nodes to it.
When creating the "Addresses" node, add the "Array" label, because it contains an array of objects.
When manually linking, set the "Addresses_global_index" link to "# Global index".
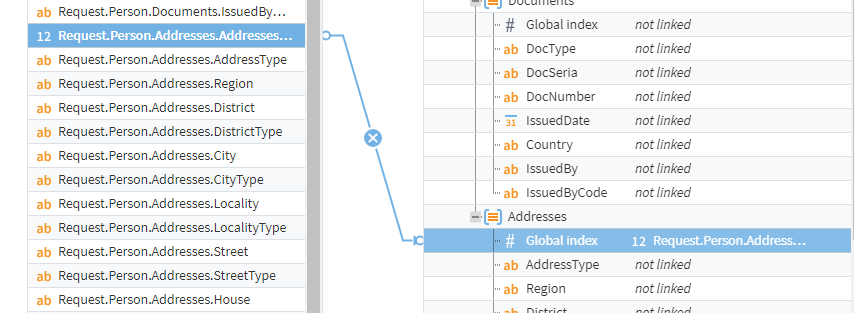
Figure 5: Manual linking
The next step is linking. It can be automatic or manual.
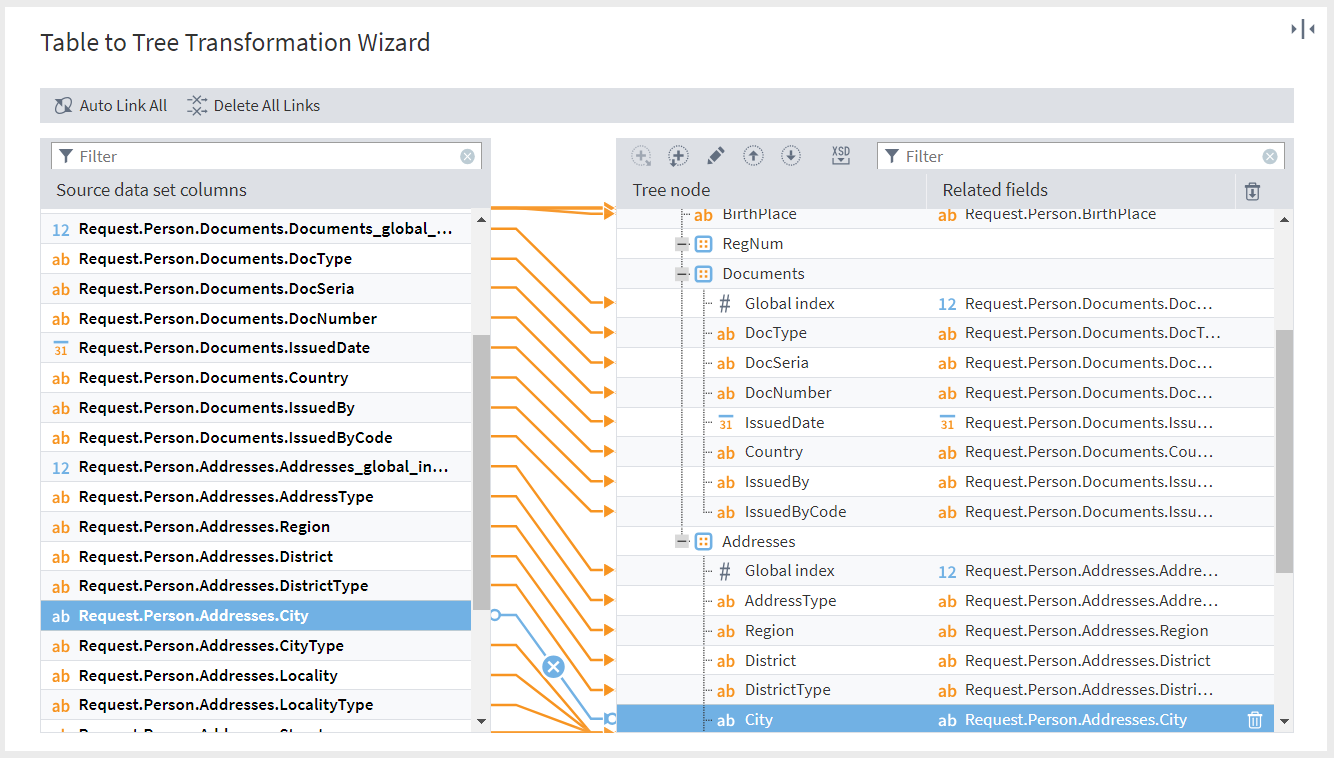
Figure 6: Setting up the Table to Tree node
The result is the following tree-like data structure.
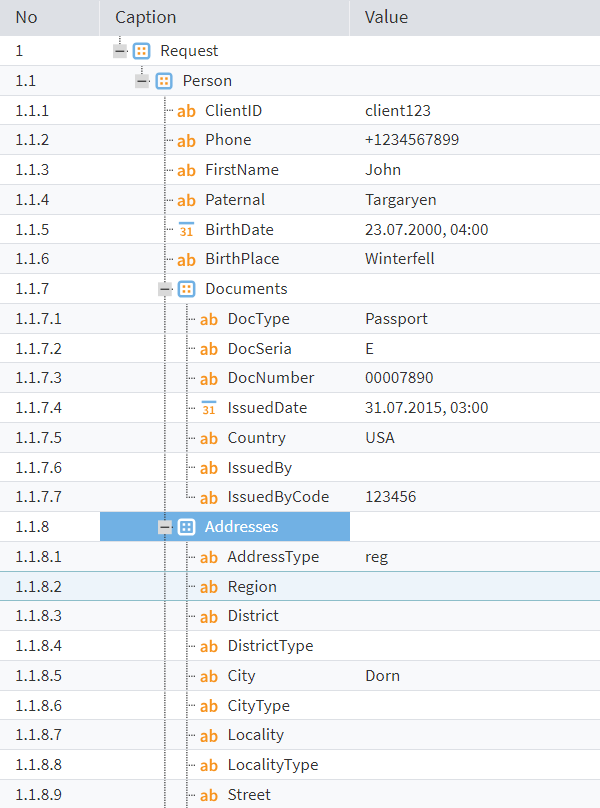
Figure 7: Tree data structure
You can convert this structure to JSON and XML files with no complications.
Next, using the Tree to Table component, let's divide the data into three tables to which we will be able to apply different algorithms.
Choose only the necessary nodes in the settings. When selecting them, you can use filtering for a quick search. If you select nodes that have different parents, you will get a table with empty values, i.e. return to the initial variant.
The table with identity data extracted from the tree looks as follows:
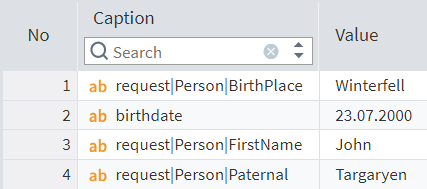
Figure 8: Table with identity data
Using the Column Union component, we create a transformed table with the data consolidated and ready for analysis.
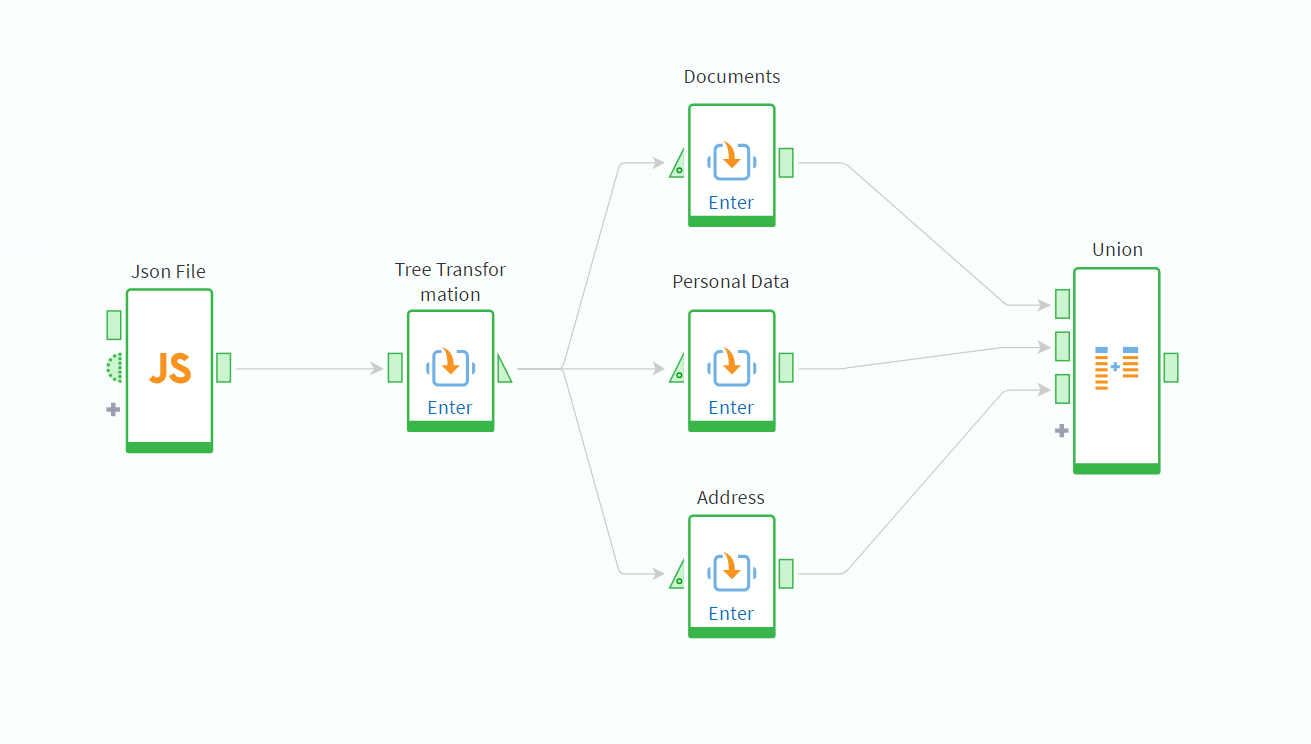
Figure 9: Workflow
Tree structures allow data to be broken down into smaller categories and analyzed in the context of a hierarchy. This approach is often used when providing data about financial transactions, accounts, customers, etc.
Conclusion
A tree data structure containing nested structures can be flawlessly converted to JSON and XML. The data correctly represents complex hierarchical relationships.
Using tree data structures on the Megaladata platform has the following benefits:
- Trees serve well for handling hierarchical data.
- A properly organized data tree allows you to quickly find and group items.
- Tree structures facilitate navigation and filtering of data at different levels.
- Tree data convert accurately to JSON and XML files.
- Trees are great for representing relationships and dependencies between data elements.
However, tree structures come with certain challenges:
- When the amount of data is large, changing the tree structure can be a complex and costly process.
- In most cases it is impossible to feed the obtained data to the input of other workflow nodes. You have to use the "Tree to table" component to perform further analysis.
Most analysis algorithms are not adapted for processing hierarchical data. Having the components for tree-table conversion allows you, on the one hand, to receive and share hierarchical information with third-party systems, and, on the other hand, to fully utilize all the analysis algorithms built into Megaladata.
See also

Megaladata 7.4.1 Release Notes

Megaladata at the Plug and Play Italy Summit in Milan
On June 16th, Megaladata participated in the Plug and Play Italy Summit, held in Milan, an event bringing together startups, investors, and key players in the international tech ecosystem.
 influences the decision-making process in 2026")
How data analysis (still) influences the decision-making process in 2026
In 2026, the phrase "data-driven" feels outdated. With the rapid evolution of agentic AI, autonomous software agents are no longer just analyzing charts; they are executing complex workflows, triggering...
About Megaladata
Megaladata is a low code platform for advanced analytics
A solution for a wide range of business problems that require processing large volumes of data, implementing complex logic, and applying machine learning methods.
GET STARTED!
It's free